LogicMonitor wades into AIOps with anomaly detection
Another country heard from in AIOps: LogicMonitor rolls out anomaly detection and alert dependency correlation, but can it rise above the noise?
An already busy market for AIOps tools gained another entrant, as LogicMonitor rolled out anomaly detection and alert dependency features this week.
The vendor has its work cut out for it to get attention in a market where competitors from application performance monitoring (APM) vendors, such as AppDynamics and New Relic, to specialized AIOps software makers, such as Moogsoft and BigPanda, already vie for customers. It must also compete with time-series monitoring tools such as Prometheus that have turned enterprise heads with highly granular cloud-native application support.
"This is a big thing I've been poking them about," said Andy Domeier, senior director of technology operations at SPS Commerce, a Minneapolis-based communications network for supply chain and logistics businesses.
Domeier serves on LogicMonitor's customer advisory board and has called for the vendor to add more advanced analytics features for more than two years, though the company was initially skeptical of the AIOps craze.
He said he is also skeptical of the AIOps buzzword, but added he's eager to use anomaly detection and alert dependency features with LogicMonitor's automatically generated dashboards, which he hopes will establish context more quickly for SPS IT pros as they troubleshoot incidents.
"With LogicMonitor, we can get to the data we care about a lot faster," Domeier said.
An IT team is only as effective as its ability to manage context, he said, which is only going to become more critical as the complexity of cloud-native application infrastructures increases.
"LogicMonitor is the leading indicator that tells us, overall, how are things going and offers a quick jump into specific systems," he added. "Anomaly detection will give us a faster and better leading indicator that lets us determine where errors are coming from and what services are affected."
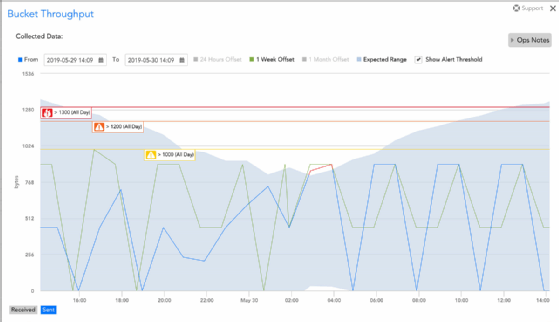
Anomaly detection in LogicMonitor's tool will become available in two phases. The first, generally available this week, adds information to troubleshooting dashboards about seasonality and typical infrastructure behavior to put alerts in context against typical patterns. The second will offer proactive alerts when unusual behavior is detected and mute alerts when behavior that exceeds resource thresholds is typical for a particular time of day, week, month or year.
Alert dependency correlation breaks down multiple alerts into groups and identifies the root alert to pinpoint the cause of an incident, which will be released in beta in July 2019. Later this year, LogicMonitor will offer a more defined system for root cause analysis that narrows down incidents to four or five key alerts per day and adds a narrative about possible causes, troubleshooting options, and their costs and tradeoffs.

LogicMonitor seeks AIOps foothold among competitors
LogicMonitor officials acknowledged their tool doesn't have the breadth of data capture from multiple sources that AIOps specialists such as Moogsoft and BigPanda offer, and that APM competitors in AIOps already offer features it still has on the roadmap, such as alert correlation and automated root cause analysis.
However, the tool has long specialized in infrastructure monitoring and is aware of network connections between resources such as those named by Domeier, which means it can offer deeper and more accurate insights into how infrastructure resource problems are related, according to Gadi Oren, vice president of products for LogicMonitor, based in Santa Barbara, Calif.
"If you have a pipe blockage in a house, for example, [another AIOps tool] might see that sinks on both the first and second floor are blocked and infer a connection between them," Oren said. "LogicMonitor understands the pipes and how water flows."
This means fewer false positives and more sharply defined correlations in LogicMonitor's AIOps mechanisms. Competitor New Relic also uses intellectual property from its CoScale acquisition to create topology views that "understand the pipes" between applications, but APM tools aren't as deeply integrated with infrastructure resources, Oren claimed.
Domeier vouched for LogicMonitor's infrastructure monitoring depth in his shop.
"The richness of the data they have when you get into the intricacies of specific databases, firewalls and network equipment ... has a lot of promise to push more relevant context more quickly to people who are trying to diagnose a complex, unknown problem," he said.
However, as with many enterprise IT shops that grapple with increasingly complex systems, SPS will use multiple tools to give it a complete view into its environment, which already include Prometheus and Grafana, in addition to LogicMonitor.
"LogicMonitor is good at monitoring the known. But for the unknown, you need more detailed logs and metrics platforms that are less structured," Domeier said. "That's where Prometheus and Grafana really shine, but I can't look at hundreds of metrics -- that's where LogicMonitor has an interesting opportunity, and I hope they close that gap."


