When distributed applications run in containers, admins suddenly have a whirlwind of metrics to track instead of just a short list. These methods reach into the heart of the task.
For developers and infrastructure architects, the implications of containers' lightweight runtime environment and associated ecosystem of automated cluster and workload management, image registries and PaaS stacks are profound: Containerization enables modular application designs using microservices. For IT operations teams, the implications of containers are equally significant, if not wholly salubrious. Microservices provide outstanding modularity, adaptability and scalability at the cost of significantly more complicated infrastructure.
IT organizations should follow design guidelines for modern enterprise applications that include the use of microservices, as well as microservices governance and troubleshooting best practices. While orchestration and as-a-service technologies for containers resolve some infrastructure management challenges of containerized applications, difficulty remains when operations teams need to identify and troubleshoot microservices performance problems.
Anomaly detection methods change from monolithic application hosting techniques to containerized microservices, often distributed on cloud infrastructure. IT operations teams must understand how microservices scale and the processes and tools to troubleshoot problems.
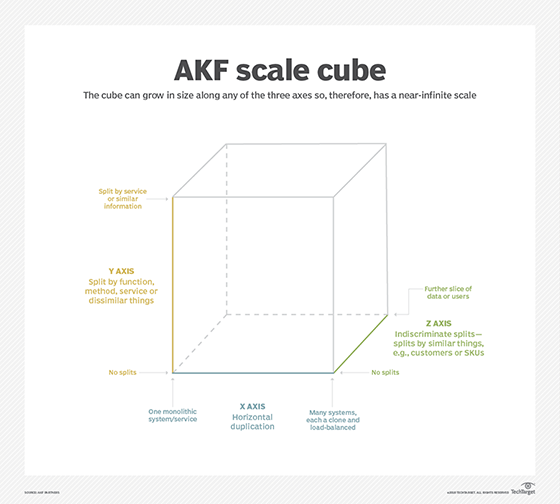
Microservices scaling in 3D
Application performance monitoring (APM) and anomaly detection require an understanding of the logical elements and infrastructure components underlying a containerized design. The scale cube (see figure) is a standard architectural model for scalable, robust, microservices-based applications. It breaks applications into three logical planes with independent scaling and design characteristics. For microservices in containers, the planes are:
X axis: horizontal duplication and cloning of container clusters;
Y axis: functional decomposition and segmentation, which occurs with microservice partitioning into narrowly defined modules; and
Z axis: horizontal data partitioning in the form of database sharding, segmenting by customer/functional unit.
AKF's cube diagram splits planes by methods, scaling and source categorization to most accurately pinpoint an anomaly.
Each dimension adds complexity to microservices performance management. If APM and anomaly detection with traditional n-tier networked applications are akin to playing chess, microservices turn the game into 3D chess. Indeed, microservices APM often encompasses more than three dimensions. Operations teams must monitor, manage and troubleshoot the platform, services and networks and track overall key performance indicators (KPIs) at both levels. The platform includes container cluster infrastructure, underlying systems and the cluster management systems. The services and networks encompass interservice communications, total resource usage, usage by application, conditions of Istio or another service mesh, and the API gateway, if used.
If APM and anomaly detection with traditional n-tier networked applications are akin to playing chess, microservices turn the game into 3D chess.
Traditional single or simple n-tier applications require platform and performance monitoring, but microservices add several logical layers to the equation. Along with more tiers come the y and z axes of the scale cube, including Kubernetes or another cluster manager for containers; a service layer and associated tools, such as the fabric and API gateways; and data and service partitioning across multiple clients.
Microservices performance classification basics
To detect and analyze performance problems, begin with the basics of problem identification and cause analysis. The techniques described here are relevant to microservices deployments. Each aims to identify and fix the internal source of application problems based on observable behavior.
A symptom-manifestation-cause approach involves working back from external signs of poor performance to internal manifestations of a problem to then investigate likely root causes. For example, the symptom of increased response times can be tracked to the internal manifestation of excess latency in message passing between the app's services, which occurred because of a failing network switch. Other potential root causes exist for those same symptoms and manifestation, however. For example, an application design using overly large message requests, or too many small messages, would cause the same issue. These root causes would be found by different tools and resolved by different people.
Change-impact analysis creates broad categories that lump together changes in component-level metrics based on their effect on external performance measures. These metric categories might include network link latency, database queue depth and CPU utilization, grouped according to assessments such as excessive resource usage, cost overages or response time.
To use another approach called cause/effect mapping, the operations staff classifies a set of root causes of performance problems -- such as system failures, resource overutilization, design errors or application bugs -- and identifies the secondary and tertiary indications thereof, such as service contention, bottlenecks and KPI anomalies.
Proactive anomaly detection methods
At the highest level, performance anomaly detection methods for microservices-based, containerized applications are no different than those for conventional, monolithic software: Compare the application's user-level KPIs to defined standards of acceptable performance. KPIs often cover transaction response time, request accuracy and systemwide resource usage ranges.
As with monolithic application operations, teams strive to find performance problems with containerized microservices applications before they become significant enough to negatively affect users. The best way to proactively find and fix performance problems is to identify -- or, better yet, predict -- anomalies at the microservice level.
Consider an analogy to the physical world: Industrial equipment makers stream data from IoT sensors tracking motor vibration and current draw into analysis algorithms to predict impending problems before the motor burns out. Similarly, microservices operators can feed time-series analysis of the internal telemetry put out by each module into APM tools to identify normal operating behavior and then detect and predict results outside of the norm.
Predictive analysis of time-series data is an active area of AI research, but existing software can already model and analyze data from any source, including microservices telemetry. MapR has an example that illustrates a predictive streaming data pipeline in which a microservice itself acts as the glue: It consumes input data, passes the data through a predictive machine learning model and outputs a predictive score. Such a scheme could be applied to low-level performance data from containerized microservices to trigger alerts on anomalous measurements. In a more general statistical modeling example, Netflix identifies outliers and suspicious anomalies in its massive data sets with a tool that helps its data teams understand and react to anomalies before performance problems are visible to consumers.
SignifAI's machine learning software works with the Prometheus monitoring platform to reduce false alerts and create correlations to assist with root cause analysis of microservices performance problems. Numenta HTM, which stands for hierarchical temporal memory, technology learns from time-based patterns in unlabeled data. Microservices anomaly detection methods would benefit from such machine learning modeling.
Among the commercial APM products using machine learning for anomaly detection are AppDynamics; CoScale, which includes options for Kubernetes and OpenShift applications; Datadog, which can be applied to live container monitoring; Metricly for public cloud users; SignalFx; Sysdig; and Unomaly. The anomaly detection methods used by these tools are agnostic to the data source. They can be applied to measurements and system logs from containerized applications and supporting infrastructure.
None of these techniques work, either reactively or predictively, without data from the application in operations. Tools require real-time, fine-grained performance and operational data from individual microservices, container clusters, cluster networks and service fabrics. Microservices developers should ensure that a component module produces ample internal telemetry and learn the basics of machine learning and other techniques for streaming data analysis to improve troubleshooting for operations.