Sergey Nivens - Fotolia
Follow this Grafana Loki tutorial to query IT log data
IT pros evaluating log data should try tools like Grafana Loki. Follow this tutorial to see how it works firsthand, exploring LogCLI and LogQL.
Grafana Loki, a log processing tool, is designed to work at high speeds and large scale, on the minimum possible resources. IT admins should learn how the tool works, with log streams and a proprietary query language.
Loki indexes only the date, system name and a label for logs. This approach contrasts with ElasticSearch, which indexes every available field. When users run a query in Loki, it starts off with this smaller subset, rather than the whole database, and then uses regular expressions and allows for aggregations to process the rest.
Loki works either within the Grafana GUI or with a command-line interface (CLI). This Grafana Loki tutorial features the LogCLI command-line interface and explores LogQL, the query language used with Loki. Loki's design builds on its companion tool, Promtail, which scans the server and collects any available logs to ship off to Loki for storage.
As a prerequisite for this Loki tutorial, install Grafana. Then, install Loki, as explained below, and connect it to Grafana as a data source. Once Loki is up and running, work with log streams, key-value pairs, operators and regular expressions to quickly search aggregated log data for information.
Install Loki
While the installation procedure for Loki is complicated, the simplest approach is to use Docker.
This command installs Loki and then Promtail:
docker run -d --name=loki -p 3100:3100 grafana/loki

docker pull grafana/promtail
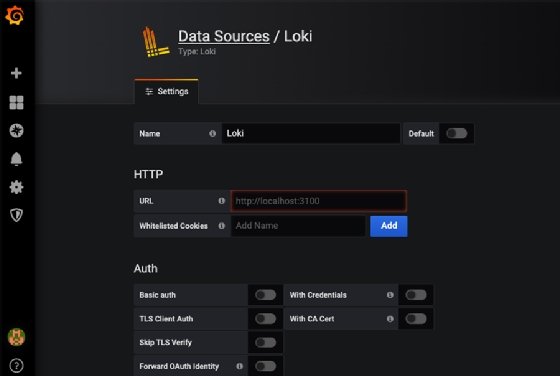
Then, log into Grafana and attach the Loki data source.

Install LogCLI
To install the LogCLI interface, start with downloading the Go programming language on your server. Choose the latest version -- the one in the Ubuntu repository is not the latest.
Then, run these commands to install LogCLI, and test that it works:
export GOPATH=$HOME/go

go get github.com/grafana/loki/cmd/logcli

export LOKI_ADDR=http://localhost:3100

$GOPATH/bin/logcli

$GOPATH/bin/logcli labels job
The outputs for these commands should look like this:
http://localhost:3100/loki/api/v1/label/job/values?end=1593264408227358593&start=1593260808227358593
LogQL
Loki uses a proprietary query language called LogQL, which acts as an extended grep command-line utility -- a pattern-matching engine that supports searches with regular expressions. As with Loki, LogQL's syntax and design are similar to those of the container monitoring tool Prometheus.
The query differs from other systems in that it uses a log stream. Think of a stream as a slice of the database; the goal is to work with a segment, rather than the entire thing, as this simplification improves the tool's performance.
Admins can store streams separately to further boost performance. Place the stream into a system designed for high-speed queries and the remaining log line into a repository for data that is not typically indexed, such as the freeform part of a log. For example, any JSON-supported database can host streams, because the stream is written in JSON. Then, put the rest of the log into an object repository, such as Amazon S3.
After locating the stream with a label key-value pair, attach a grep-like regular expression to the end to make the complete query.
LogQL reduces log stream volume, at which point the regular expression search prints any lines that match the requested search. To create a label in the query expression, wrap it in curly brackets {} and use key-value syntax. Separate expressions with commas.
{labelKey="labelValue"} (operator). "regular expression or just regular text"
Options for operators are:
| Operator | Pattern |
| = | equal |
| != | not equal |
| =~ | regex matches |
| !~ | regex doesn't match |
That line pulls out the chunk, which is the label and data items mentioned above. Chain the chunk together with regular expressions and grep to match the log lines pulled into scope by the first part of the query, like this example from Loki documentation:
{instance=~"kafka-[23]",name="kafka"} != "kafka.server:type=ReplicaManager
Loki supports various statistical functions as well, such as standard deviation, average, count and min and max.
Loki uses the Prometheus range vector concept to return a sample of records filtered by time.
IT admins can perform math functions, inequalities and logical operators. The math functions work against the statistical functions, and these item functions:
- rate
- count_over_time
- bytes_rate
- bytes_over_time
Here's an example of how to work with Loki in a real IT environment. We have an Nginx web server running in the AWS Europe (Frankfurt) Availability Zone. Use the count_over_time function to calculate a log line count for the last 10 minutes for that server:
count_over_time(job="nginx",availabilityZone="eu-central-1" [10m])
Or, add an operator and regular expression to filter those lines to include only those that say error:
count_over_time(job="nginx",availabilityZone="eu-central-1"  |= "error"
[10m])


