Observability blitz intensifies with Grafana, AppDynamics
Grafana and AppDynamics are the latest monitoring vendors to try to capitalize on the hype around observability, as users face more complex choices than ever in this market.
Grafana Labs and AppDynamics are the latest IT monitoring vendors to look to reinvent themselves as purveyors of observability tools and expand beyond their previous telemetry niches.
This week, Grafana Labs expanded its Loki log analytics tool in version 2.0 to add richer visibility into the contents of logs, accessible through a new query engine called LogQL, and added an OpenTelemetry-based distributed tracing utility, Tempo, to its open source portfolio.
Grafana users say they hope these updates will allow them to consolidate the number of monitoring tools they use, especially since Grafana Loki 2.0 puts its ability to parse log data on a more equal footing with predecessors such as Elasticsearch.
"Right now, we push Nginx logs to Elasticsearch and it indexes them, and then we use that to derive metrics," said Zach Swanson, principal DevOps engineer at Seniorlink, a healthcare company in Boston. "I want to entirely replace that with Loki LogQL."
Part of Swanson's motivation for replacing Elasticsearch with Grafana Loki is complexity -- the Loki 1.0 release last year offered a bare-bones log collection and analytics tool that lacked many features of established log analytics platforms but could store and retrieve data quickly and cheaply.
Loki 2.0 still doesn't match all the features of Elasticsearch for advanced business intelligence analytics, but it works for Swanson's purposes. Most importantly, the price is right, since Loki 2.0 also eliminates a previous back-end requirement for a NoSQL data store. This means that logs can now be stored in cloud object repositories such as Amazon's S3 rather than a more costly service such as DynamoDB, driving costs down further.
Right now, we push Nginx logs to Elasticsearch and it indexes them, and then we use that to derive metrics … I want to entirely replace that with Loki LogQL.
Zach SwansonPrincipal DevOps engineer, Seniorlink
"Elastic is great, but the labor and resources required for it are tremendous; it's very complex," Swanson said. "A good Elasticsearch cluster is probably going to cost $1,500 per month for a fairly small deployment, [but] I'm running [Loki] for about $80 per month in AWS Fargate right now, total, for four environments."
AppDynamics rethinks data collection model, APIs
Cisco's AppDynamics, meanwhile, released the successor to its AppIQ application performance monitoring (APM) product, new software it calls the Full Stack Observability Platform. It features an overhauled back-end data model and set of APIs for ingesting a broad array of data from third-party tools as well as its own.
The new platform is now generally available and includes a cloud data collector that can correlate information from AWS CloudWatch about underlying cloud infrastructure services with the application code that runs on them through an updated UI.
Further telemetry collection and IT infrastructure automation integrations are planned for the new platform in subsequent releases, including integration with ThousandEyes, a recent Cisco acquisition that monitors ISP and managed services networks, said Vipul Shah, chief product officer at AppDynamics.
"ThousandEyes gives users an understanding of SLAs for those services, and AppDynamics can help you understand their impact on the business," Shah said.
AppDynamics could previously collect and analyze multiple types of data, such as logs and metrics, through its agents, but the new platform will allow it to collect data from open source tools and third-party agentless services, Shah said. In part, this is due to an entirely new approach to modeling data on the back end.
"Previously, all entities had to fit into an app, tier, node model, but that's been immensely expanded -- [the new platform] has no pre-built models and everything is done through an API," he said. "This will allow us to release [updates] faster."
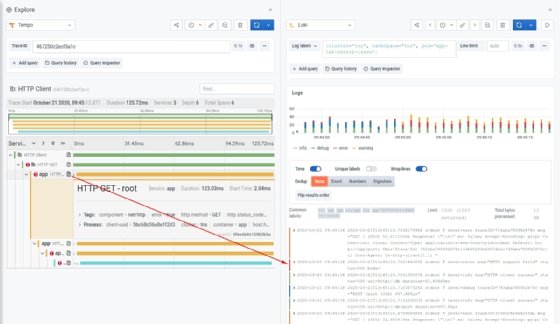
Grafana Labs has rolled out Tempo, a distributed tracing utility based on OpenTelemetry standards, shown in this screenshot.
All aboard the observability bandwagon
These are the latest in a recent barrage of observability announcements, which have also included new pitches from Splunk, Sumo Logic, New Relic and Oracle. Observability is, by now, a buzzword, but it generally refers to IT monitoring tools that take in multiple forms of IT telemetry data and offer flexible queries across those data types for troubleshooting.
"Observability at this point is almost just the new word for monitoring," said Nancy Gohring, an analyst at 451 Research, a subsidiary of S&P Global.
Where most tools differ from previous monitoring approaches, however, is in replacing the previous generation's pre-designed dashboards with bespoke querying systems, Gohring said.
"Traditional monitoring usually came with a whole bunch of dashboards out of the box that represented the most common types of problems that people had running particular technologies," she said. "In modern, cloud-native systems, there are some common problems, but incident responders today talk about having unique problems every day of the week, and to diagnose it, you have to search the data you're collecting from different perspectives."
The new OpenTelemetry standard for distributed tracing data collection has been key to many vendors' ability to broaden their scope and offer distributed tracing support, where before that had been left to APM specialists.
"The enthusiasm around OpenTelemetry is indicative that people want the data collection layer standardized and simplified," Gohring said. "Historically, many log and infrastructure monitoring vendors didn't get into APM because of distributed tracing, but as OpenTelemetry evolves, it will allow a new set of vendors to get into that area as well."
This shift will also mean the focus of competition between vendors moves from data collection methods to back-end data analytics. This is a selling point for Grafana Tempo, which uses the same relatively low-cost storage as Loki and Grafana's time-series database project Prometheus, Seniorlink's Swanson said.
"I still have to instrument [applications] to use it, but [Grafana] solved the 'back end' side of the tracing, since those typically used something like Cassandra or Elasticsearch to store the data," Swanson said.
Grafana also has the advantage of experience serving as a front end for other open source data collection tools such as Jaeger and Zipkin. Its support for Prometheus, long used for monitoring Kubernetes, also points in its favor as a centralized observability tool as his company's infrastructure evolves, Swanson said.
Amid this flurry of product releases, enterprise IT teams that previously used many monitoring tools may be able to consolidate them into a single product that offers a multi-dimensional view of log, metric, event and tracing data, but the choice may still be a complex one at first, Gohring said.
"Things could get even more complicated for end users, because there's going to be even more choice," she said. "But ultimately, it should be a good thing … users want to reduce the number of tools they're using, and they don't want to have to do the work of all the integration that allows you to bring all this data together -- eventually they may be able to whittle down to just their favorite tool."