Top 4 IT monitoring tools for 2026
Effective monitoring is a cornerstone of any IT environment. Examine the available tool options for IT monitoring, and compare their features, benefits and costs.

Infrastructure monitoring tools are designed to keep an eye on the health, performance and availability of IT infrastructure components. This can include anything from routers and switches to servers, applications and databases.
These tools collect and analyze various metrics to detect potential issues early, enabling IT staff to respond proactively before a problem arises. Some infrastructure monitoring tools also perform root cause analytics, enabling IT staff to quickly identify the source of a problem and take corrective action when it occurs.
Top 4 IT monitoring tools
There are hundreds of infrastructure monitoring tools available, ranging from simple monitoring scripts to complex, multiplatform tools intended for enterprise use. The tools discussed in this article are those with the highest Gartner peer ratings, particularly for North America.
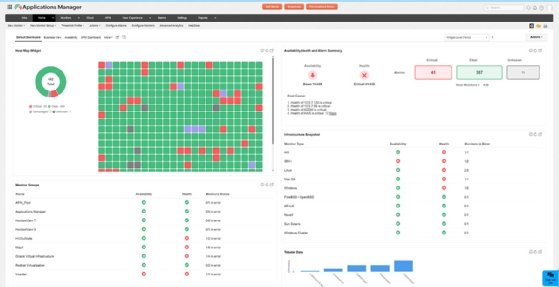
1. ManageEngine Applications Manager
ManageEngine's Applications Manager is a tool for digital experience and application performance monitoring. Although this tool is geared toward monitoring applications, it also monitors IT infrastructure to the extent that the infrastructure affects application health and performance.
ManageEngine offers two different versions of this tool. The Professional version is intended for organizations that need to monitor fewer than 500 applications, while the Enterprise version can handle more than 500 applications and scales up to 10,000 monitors.
Features
Applications Manager is primarily a UX monitoring tool, and it performs both synthetic monitoring and real user monitoring. Additionally, the tool can monitor URLs to detect errors that might occur or unauthorized changes to website content. The tool is also capable of monitoring REST API endpoints to detect downtime and can track Simple Object Access Protocol requests.
Applications Manager can monitor a variety of infrastructure resource components, including servers, converged infrastructure, virtual servers and containers. Similarly, the tool can monitor various services, including databases, ERP suites, Hadoop and Spark instances, middleware and more.
Pros
- Applications Manager provides comprehensive unified monitoring.
- It works well for monitoring both traditional and hybrid infrastructures.
- The software can offer code-level insights when bottlenecks occur.
Cons
- There is a complex UI with a potentially steep learning curve.
- There aren't quite as many native integrations as for some competing products.
Use cases
ManageEngine Application Manager is best suited for organizations that are most interested in ensuring that their applications are healthy and performing well. The tool might prove especially useful for organizations that build custom applications.
2. Catchpoint
Whereas many monitoring tools focus specifically on monitoring an organization's on-premises and cloud resources, Catchpoint attempts to monitor the entire internet stack, including SaaS applications, DNS servers, content delivery networks, WANs, APIs and more. The idea is that with over 3,000 agents worldwide, organizations can see the internet in the same way that their remote users and customers do. And if an issue does occur, Catchpoint can use AI-assisted root cause analytics to quickly find the source of the problem.
Features
Catchpoint is designed to enable tier 1 app resilience by monitoring application delivery and performance. In doing so, it can troubleshoot connectivity problems on both the internet and on enterprise networks. In fact, Catchpoint lets organizations monitor global web performance. This can be particularly useful for organizations with employees or customers located worldwide. Although Catchpoint places a significant emphasis on internet monitoring, the software can use enterprise agents to monitor resources across offices, clouds and data centers.
Pros
- Because Catchpoint monitors the internet, it can potentially locate problems with public networks that are affecting workloads.
- Catchpoint performs both real and synthetic user monitoring.
- The tool can monitor AI workloads, such as large language models (LLMs) and chatbots.
Cons
- The starting price for Catchpoint is $10,000 per year, which might be too high for startups.
- Catchpoint is likely overkill for smaller sites.
Use cases
Catchpoint is ideally suited for large enterprises with an e-commerce presence or those with remote employees worldwide.
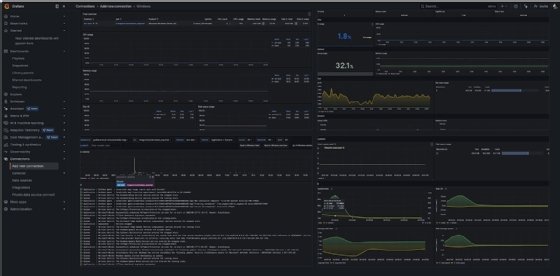
3. Grafana Cloud
Grafana Cloud is a cloud-hosted observability and monitoring platform. The tool collects various metrics, which it combines with log data and traces, and then displays the information across a series of dashboards. The tool also allows for synthetic monitoring and performance tracing. It can use AI to derive insights from the data and can generate alerts if necessary.
Features
Dashboards are at the center of the Grafana Cloud experience. The software can produce a variety of colorful and highly detailed dashboards that reflect the state of an organization's infrastructure. The software collects this data through a combination of log ingestion, telemetry and synthetic monitoring.
Grafana Cloud also makes heavy use of AI and machine learning. These features help identify anomalies occurring within the infrastructure and assist with capacity planning. AI is also used to make predictions that can be plotted on a dashboard, letting users see how their infrastructure is likely to behave.
A feature called OnCall consolidates alerts from Grafana, Prometheus and AlertManager, bringing everything together in one place.
Pros
- Although enterprise pricing starts at $25,000 per year, Grafana offers a free tier for personal projects and a pro version that starts at $19 per month.
- Enterprise-grade tiers support single sign-on, Lightweight Directory Access Protocol integration and role-based access control.
- Grafana uses AI to detect anomalies and features an LLM that can be used for query assistance.
- There is a huge number of integrations that are supported.
Cons
- Because Grafana Cloud is delivered as a hosted service, it's less customizable than other monitoring tools.
- The initial setup process might involve setting up agents and pipelines and can be a complex undertaking.
Use cases
Grafana Cloud can serve a wide range of use cases, but it might be best suited for cloud-native environments in which traces must be performed across distributed systems -- such as when microservices are heavily used. It's also well suited for DevOps teams that need deep monitoring capabilities.
4. Kentik
Kentik's network monitoring platform is designed to provide a consolidated view of an organization's network health and performance. The software compiles this data by examining flow telemetry, cloud logs, Simple Network Management Protocol (SNMP) data and synthetic tests. This information is collected for resources running both on-premises and in the cloud. The system provides automated insights and deep visibility into network issues, even across complex and distributed networks. The software can even create visual network maps.
Kentik delivers its software on a subscription basis with prices starting at $2,000 per month for the Pro plan. There is also a Premier plan. However, various features require an additional license. Kentik offers a free 30-day trial of its software.
Features
The Kentik software is feature-rich, with the core module providing capabilities such as a network explorer, data explorer, report scheduler, insights and alerting, API access, capacity planning and an observation deck.
Those who need additional capabilities can use additional modules. Many of these modules are included in the subscription cost, but some require an additional subscription. For example, the Kentik Protect module provides protection against DDoS attacks. The Kentik Cloud module helps with cloud migrations, security validations, performance optimization and cost reduction.
There is also a module called Kentik Protect Advanced, which provides security features that extend beyond those found in the standard Kentik Protect module. This module handles analytics, detects botnets and assists with mitigation and incident response.
A module called Kentik Synthetics delivers performance and digital experience monitoring and performs continuous testing. The Kentik NMS module provides more detailed information about network interfaces and protocols, while the Kentik Edge module monitors edge traffic and performs cost optimizations.
Pros
- The software delivers a single-pane-of-glass display and supports multivendor and hybrid networks.
- Telemetry can be provided by a variety of sources, including SNMP, NetFlow/IPFIX, cloud logs and synthetic testing.
- The software's automated insights and rich visuals are helpful for spotting issues quickly.
Cons
- The software's price point might put it out of reach for smaller organizations.
- There can be a steep learning curve associated with using the software.
Use cases
Kentik is best suited for medium to large enterprises that require deep visibility across extensive and highly complex distributed hybrid networks.
Brien Posey is a former 22-time Microsoft MVP and a commercial astronaut candidate. In his more than 30 years in IT, he has served as a lead network engineer for the U.S. Department of Defense and a network administrator for some of the largest insurance companies in America.