Improve container monitoring with these strategies and tools
Containerized infrastructure significantly expands the number of available metrics within an IT environment. Take a layered approach to container monitoring and lean heavily on automation.
The emergence of containers and cluster management systems has multiplied the number of objects for IT teams to monitor -- which complicates the environment significantly.
Fortunately, there are certain steps IT admins can take to efficiently monitor containerized environments.
The container monitoring challenge
VMs and traditional applications have been replaced by a combination of container hosts; container software platforms; cluster management systems, such as Kubernetes; service routing and service mesh software; and disaggregated microservices. For IT teams, this results in a large number of monitoring parameters in a single environment.
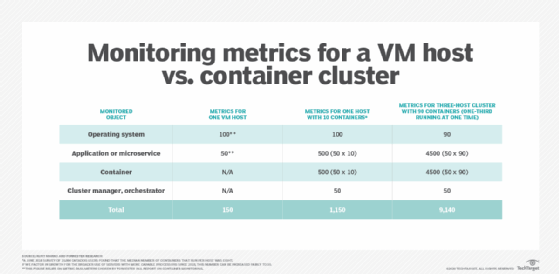
For example, Figure 1 -- which references data from both a Forrester Research report and a Datadog survey -- compares three different scenarios to illustrate the monitoring challenge when container clusters replace VMs. The figure estimates that a three-host container cluster generates at least 60 times the measurable parameters, or metrics, compared to a single VM host.

Microservices further complicate IT monitoring and troubleshooting with an intricate set of dependencies -- admins must trace measurable anomalies in one application or service to root-cause problems in another. Such granular, container-based workloads are subject to cascading failures caused by intra-cluster communication problems and bottlenecks at upstream services.
One primary advantage of container environments is how easily admins can scale workloads up and down, restart and migrate them to different cluster nodes. However, this requires monitoring systems to track transient objects, which exacerbates complexity. This combination of transient, ephemeral resources and interdependent workloads -- along with an increase in measurable metrics -- makes container monitoring a challenge.
Container monitoring KPIs
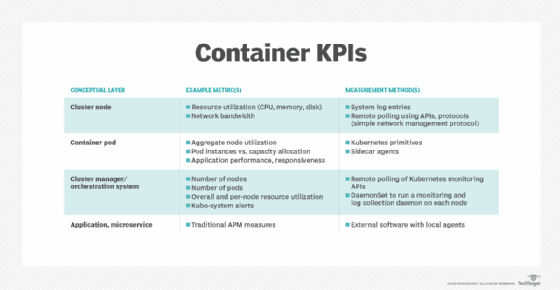
As Figure 1 indicated, container infrastructure and applications require several sets of metrics that cover different layers of the environment. Figure 2 below shows one way to logically break down the monitoring process, with example measures for each.

To minimize alert inundation, particularly false positives, collect metrics granularly at the node and container level, but set alerts at the application and service level -- the measures most visible to users.
Container monitoring best practices
Cluster monitoring presents both technical and organizational challenges. Containerized infrastructure blurs boundaries between developers, application owners and IT operators, which can hamper interdepartmental trust and create communication issues. To combat these issues, instate a cross-functional team that's responsible for container monitoring design, implementation, data collection and analysis. For all but the largest organizations, most of these team roles are part-time responsibilities, with only a few staff to maintain the monitoring systems and watch real-time results.
The volume and variety of data that container environments generate are formidable -- far more than manual processes can manage effectively. Thus, automation is a critical piece of container monitoring. Everything -- including data collection, aggregation and correlation, analysis and presentation should be automated. Increasingly, this requires tools that incorporate machine learning to identify baseline norms, anomalies, event correlations and root cause. Commercial products include AppDynamics, Datadog, Dynatrace, Sumo Logic and Wavefront, which is now VMware Tanzu Observability. Open source software includes Elastic Stack, Grafana, Prometheus and Sysdig Inspect. IT operations teams should also integrate monitoring tools, agents and configurations into automated provisioning -- or infrastructure-as-code -- platforms such as Ansible, Apache Mesos, Chef and Salt.
In addition to the typical infrastructure metrics identified above, identify the high-level factors that constitute a successful, usable application. It's easy to measure CPU utilization, pod usage versus capacity, and intracluster network latency, but it's much more difficult to quantify measures of success from the perspective of a business manager or application user. However, it is critical to use KPIs that show holistic application performance. Examples include the number of successful transactions per minute, latency per transaction or operation, and the percentage of failed or retried transactions. Such measures capture end-to-end performance that is particularly difficult to quantify for microservices-based applications with a dozen or more sub-components, each of which might look normal on a monitoring dashboard.


