
Getty Images
Examine a captured packet using Wireshark
Wireshark is a useful tool for capturing network traffic data. Network pros can make the most of the tool by analyzing captured packets to see what that data means for troubleshooting.

It's straightforward to capture network traffic with tools such as Wireshark and tcpdump. Many administrators run into trouble when they try to understand what they've captured.
This article explains the primary components of captured data and relates this information to the TCP/IP model. The article doesn't cover how to use Wireshark or its features and options. I provide only the basic steps to capture packets -- enough for you to grab a packet and apply the interpretive information provided throughout.
Take the following steps to initiate a capture in Wireshark:
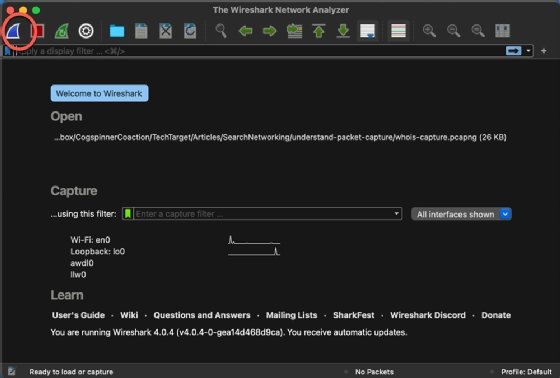
- Open Wireshark.
- Set a capture filter, and select the interface on which to capture.
- Start the capture.
- Generate traffic by connecting to a website, pinging a remote device or attempting any other network connection.
- Stop the capture.
Wireshark captures an immense amount of data quickly if you don't use a filter. While this might be what you want, be sure to set an effective filter if you know the protocols for the service you're troubleshooting. Don't run the capture any longer than you must. Wireshark has various search and filter options, but a targeted capture is much easier to work with.
I use Wireshark in this article because it's common, has a relatively simple GUI and is flexible. But many other powerful protocol analyzers are available, such as tcpdump. You can analyze the content you capture with those tools with the information below.
Wireshark is powerful and has many options beyond this article's scope, such as network analysis and performance information. Also, Wireshark v3 organizes the output into three vertically stacked window panes. Wireshark v4 uses the same three panes, but the Packet Details pane is in the lower-left corner -- it was the middle pane in v3 -- and the Packet Bytes pane is in the lower-right corner.
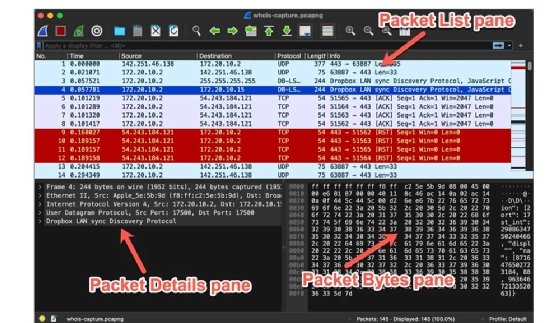
Select a frame in the Packet List pane
In the new Wireshark interface, the top pane summarizes the capture. It displays one or more frames, along with the packet number, time, source, destination, protocol, length and info fields.
Use the protocols, source and destination addresses, and ports columns to help you decide which frame to examine. Click on a frame to select it, and then look at the two lower panes for details.
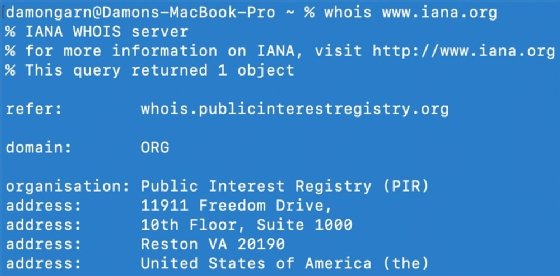
The sample capture for these screenshots is a simple Whois query to www.iana.org. This example generates DNS and other traffic that is handy for the explanations below.
Interpret the Packet Details pane
Before I examine the various headers and contents, let's review the TCP/IP model to explain the results in the lower-left Packet Details pane.
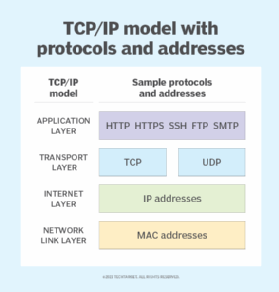
Below are the TCP/IP model layers and their associated protocols:
- Application layer protocols. HTTP, HTTPS, SMTP, Secure Socket Shell (SSH) and others reside in this layer.
- Transport layer protocols. TCP and User Datagram Protocol (UDP) reside in this layer. TCP is connection-oriented (stateful), while UDP is connectionless (stateless). If you capture TCP packets, notice how handshakes that consist of SYN and ACK messages intersperse with the data to ensure all packets arrive at the destination. These units are usually called datagrams.
- Internet layer protocols. These protocols govern communication and logical addressing, such as IP addresses. This article focuses on IP, but other protocols exist. These units are usually called packets.
- Network link layer data. This layer displays Ethernet information, including frame types and source and destination MAC addresses. These units are usually called frames.
Wireshark displays this output from the bottom of the TCP/IP model upward. Frame information -- the bottom of the TCP/IP model -- resides at the top of the pane in the lower left of the Wireshark screen.
Understand the headers
How is this information helpful? Relating the headers in the captured frames to the TCP/IP model helps troubleshooters visualize the layers at which problems might occur, which helps identify possible culprits. The following sections address the various layers in more detail.
Frame content
This frame section provides Ethernet information, such as frame size, time of capture and the physical interface on which the frame was captured.
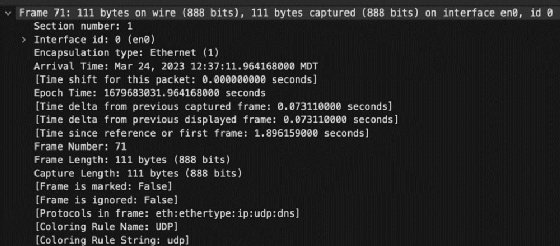
Administrators can use this information to examine frame size, for example. Certain devices might have issues accepting frames that exceed the standard size. Troubleshooters can also verify the interface on which the data was captured to ensure information flows through the proper connection.
Ethernet content
Next is Ethernet II content, including source and destination MAC addresses. Depending on the frame's direction of travel, the local MAC address is either the source or destination address, and the next network device's MAC address is the other.

Confirm the MAC addresses are correct to combat security issues, such as Address Resolution Protocol poisoning or spoofing. Troubleshooters might also confirm which local interface is in use with the MAC address.
IP content
Next is the IP section, with source and destination IP addresses and port numbers. For most networks, the address structure is IPv4. Time-to-live information exists here, as does fragmentation instructions. Finally, a field defines whether the packet uses TCP or UDP at the transport layer.
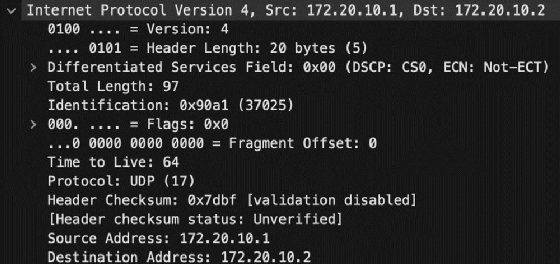
Network technicians can verify the IP addresses are valid and expected. Remember, an address beginning with 169.254.x.x is not valid on the network and indicates a possible Dynamic Host Configuration Protocol problem. Techs can also confirm the source and destination IP addresses are as expected to reduce issues of DNS poisoning or incorrect name resolution settings.
Transport content
Next is a section containing transport layer information. You should see either TCP or UDP here, depending on the type of datagram captured. Remember, TCP uses the three-way handshake to enumerate the data exchange, which ensures the source device resends any lost data.
This section displays the source and destination ports, too. If the packet originates from the client computer, the destination port is the service port number. For example, if the destination system is a web server, the destination port number is 80 or 443 (HTTP or HTTPS). The client's port number is a randomly generated number between 1,024 and 65,535 -- this range varies by OS. Both port numbers appear in this header.
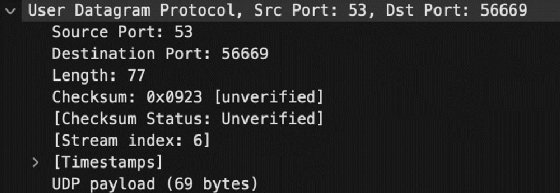
Confirm the client and server use the correct service port number. If you captured packets on the server, this is the destination port number on inbound packets. This is especially important with any nonstandard port numbers for custom applications or odd firewall rules in place.
Application content
The application layer information is at the bottom of the Packet Details pane but at the top of the TCP/IP model. This information varies by service and protocol. For example, when using HTTP, the pane includes instructions such as GET or the contents of the requested webpage. For capture targeting, you see information with SMTP, Post Office Protocol 3 or Internet Message Access Protocol. The same goes for services such as SSH, network file sharing, DNS, etc.
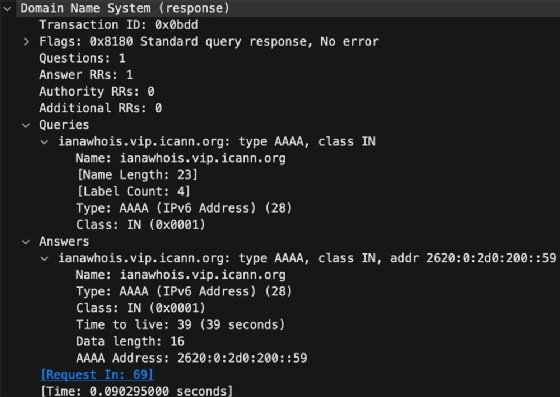
Applications are preconfigured for specific ports, so there probably isn't much room for misconfiguration here. You could use this information to ensure the destination services are running on the server.
Wireshark can display data exactly as you'd expect to find it in the TCP/IP model.
Can you relate the content of the captured packet to the seven layers of the OSI model? Each layer is represented in the captured information.
The header information in the capture helps confirm that addresses, ports and other settings meet expectations. Such captures tell what is happening on the network, rather than what should be happening.
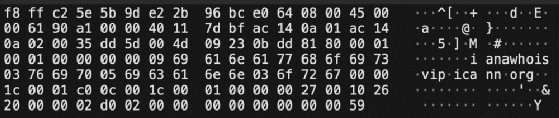
Interpret payload information
The Packet Bytes pane in the lower-right corner of Wireshark displays the payload. This content can be the end-user data security professionals worry about. Unencrypted protocols, such as HTTP, Telnet, SMTP and others, don't protect the confidentiality of their payload, so the data is shown in this window. I frequently demonstrated this in my tech courses using Telnet -- the password was displayed in this pane.
Can you find the Whois query in the content example below?
The payload information demonstrates the importance of HTTPS, SSH and other protocols that encrypt data -- or the use of IPsec, which can encrypt protocols that don't offer built-in encryption themselves.
You probably aren't too interested in the payload as part of network troubleshooting. Instead, you're likely concerned with questions of connectivity, and that kind of troubleshooting involves source and destination addresses and port numbers.
Apply what you've learned
Once you understand how Wireshark displays information and how that information relates to the TCP/IP model, consider how you can apply it. Below are a few basic troubleshooting scenarios where examining network headers could be helpful:
- You might know which connections should be made, based on MAC or IP addresses, port numbers, etc. The headers show which connections are being made or attempted.
- Use Wireshark on either side of a firewall to see what network traffic flows through it. This might help confirm firewall rules.
- Identify numerous error messages indicating a failing network interface card, network flooding, high latency or timeouts.
- Identify custom ports for new or unfamiliar network applications. These applications, especially if developed in-house, might use nonstandard ports. You can identify these ports to ensure they are known for firewall configurations.
Wrap-up
Packet sniffers, such as Wireshark and tcpdump, are often known as security tools, but they certainly have their place in a troubleshooter's toolbox. By viewing individual packets, administrators can better understand exactly what traffic moves on the network and how that traffic is addressed and recognized. Relating the theoretical TCP/IP model layers to the practical packet headers is useful.
Damon Garn owns Cogspinner Coaction and provides freelance IT writing and editing services. He has written multiple CompTIA study guides, including the Linux+, Cloud Essentials+ and Server+ guides, and contributes extensively to TechTarget Editorial and CompTIA Blogs.