
Getty Images
3 ways to troubleshoot using Wireshark and tcpdump
Protocol analyzer tools, such as Wireshark and tcpdump, can help network administrators identify protocols in the network, analyze network performance and discover network devices.

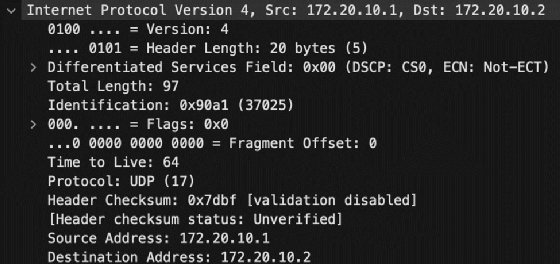
Protocol analyzers intercept network traffic, enabling network technicians to view packet headers and content. From a security perspective, the payload content is of interest because that's where a user's confidential data is exposed. However, for troubleshooting, it's also useful for network pros to know about source and destination information or what protocols are in use.
Tools like Wireshark and tcpdump display both source and destination MAC addresses, which are unique identifiers for the specific network interface cards (NICs) that transmit and receive data. Protocol analyzers also expose source and destination IP addresses, showing the logical addressing of the two devices and indicating whether routers are -- or should be -- passing information between segments.
Wireshark and tcpdump are two common protocol analyzers used in troubleshooting. Both capture network traffic and log the results for later examination.
Packet capture review
This article doesn't show the details of using protocol analyzers, but instead demonstrates their role in troubleshooting. However, below is a quick summary of the capture process so you can play along with the scenarios.
Wireshark
Install Wireshark on your Mac, Windows or Linux system. Launch the program, and observe that you can specify which NIC to capture on and filter for traffic types during the capture. Filtering is essential on busy networks, or you'll receive a vast amount of information quickly.
Press the Start capturing packets button in the toolbar (it looks like a blue shark fin). Results appear right away. Select the Stop capturing packets button (red square) when you've collected enough data. Select Save this capture file to save your results.

The latest version of Wireshark has a slightly different interface than earlier versions. Below are the primary panes it displays:
- Packet List -- at the top.
- Packet Details -- on the lower left side.
- Packet Bytes -- on the lower right side.
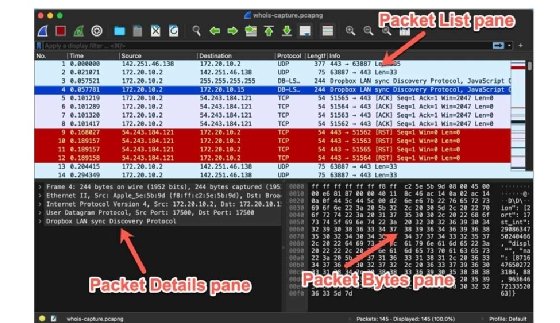
Note: The older Wireshark interface had the three panes stacked vertically, with the Packet List pane at the top, the Packet Details pane in the middle and the Packet Bytes pane at the bottom.
Tcpdump
The tcpdump utility is not as user-friendly as Wireshark. But it is lightweight, and you can easily run it on the command line. It is powerful and contains many options for filtering the exact data you need. It's usually found on Linux systems.
Run the following command to start a capture:
tcpdump -i eth0 -w dump.pcap
End the capture with Ctrl+C.
The example above captures traffic on the eth0 interface and writes the results to the dump.pcap file for later analysis. It's best to use the .pcap file extension for compatibility.
This table displays a few common options for tcpdump.
| Option | Result |
| -i | Select an interface to capture on. Use any to capture on all available interfaces. |
| -D | List available devices to capture from. |
| port 80 | Filter capture by port number, such as port 80. |
| -n | Do not resolve IP addresses to names (report captures by IP address). |
| -w dump.pcap | Write the capture to a file named dump.pcap. |
| -r dump.pcap | Read the capture from a file named dump.pcap. |
You can view the capture file using tcpdump -r dump.pcap, but opening the capture file using Wireshark might be easier. It contains better search, filter and navigation tools. In Wireshark, select File > Open, and browse to the dump.pcap file location. Wireshark reads captures saved with the .pcap file extension.
While protocol analyzers are useful for penetration testing and eavesdropping attacks, they can go a long way toward helping network admins understand and troubleshoot network traffic. Whether you need to identify network traffic types, monitor network traffic or discover network devices, captures by tools such as Wireshark and tcpdump are critical.
Now, let's look at three ways network administrators can use Wireshark and tcpdump to troubleshoot the network.
1. Use packet captures to identify traffic types
Perhaps you're concerned about the type of traffic on your network, or maybe you're worried about failing NICs or viruses attempting to propagate to other hosts. If something seems wrong on the network, network admins want the ability to confirm that traffic is legitimate and valid.
Consider the following two traffic identification examples:
- Investigate NIC communications in a cluster. Intel Advanced Network Services (ANS) probes detect network team members and ensure they're up in private cloud failover clusters or other deployments.
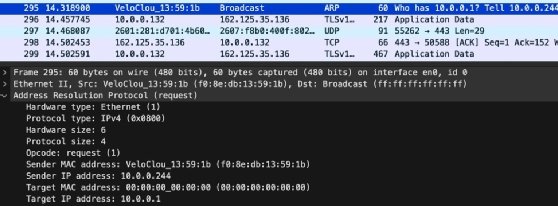
You could discover the communications between cluster team members or troubleshoot why so many ANS probes exist, which indicates a possible problem with one of the NICs. The NIC might be misconfigured, using the wrong driver or failing. Wireshark already contains a filter for ANS traffic, making this capture relatively straightforward. - Detect virus propagation based on Address Resolution Protocol (ARP) queries or known malware sites. One suspicious traffic pattern is a high number of ARP queries originating from a single machine. A virus might have infected the device and is now attempting to discover and spread to other systems. A protocol analyzer can help detect this type of traffic and its source, enabling you to check the machine more carefully.
Maybe you've read about malware that propagates over the network using recognizable URLs or other data. Use Wireshark's documentation to help generate a filter using these details to determine whether the malware is on your network.
Note: For example, read about the Hancitor malware, which is delivered via email as a link to a Google Doc. It's a great example of using Wireshark to check for specific traffic information, aiding in malware detection.
Comparing a current capture to a historical capture can be useful if you've generated a network traffic baseline using Wireshark and a host device suddenly begins sending too much traffic. You can determine whether something has changed by understanding the normal traffic load and protocols. You might also discover traffic from unusual or unknown hosts.
Use a packet sniffer alongside your regular network intrusion detection system and host-based antivirus software as another layer for mitigating network malware or to investigate further something the intrusion detection system has already identified.
2. Use packet captures to monitor network performance
Wireshark contains a statistical analysis tool to help manage network performance issues. It offers many options for understanding network efficiency and identifying opportunities for improvement.
Select the following performance filters from the Statistics menu in Wireshark:
- Capture File Properties. Provides basic information about the capture file, including file size, length of time of capture, interface, filters, etc. This information is especially useful when archiving baseline captures for later comparisons.
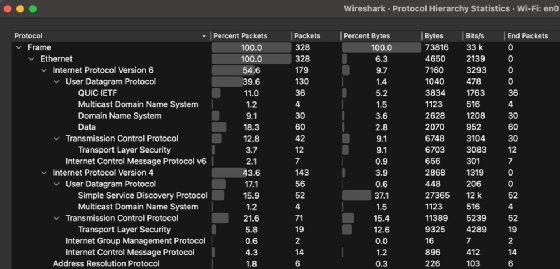
- Protocol Hierarchy. Identifies and ranks all protocols in the capture, which enables you to understand the percentage of a given protocol's traffic on the network. For example, you can easily compare DNS and Dynamic Host Configuration Protocol traffic or discover how much of your network's traffic is IPv6 versus IPv4.
- Conversations. Displays all communications between specified endpoints, including start time, traffic type, duration and size. Use what you learn to clarify what information is exchanged between two specific nodes.
- IO Graphs. Displays network traffic information in interactive graphs, enabling you to filter content and visually interpret performance information. For example, you might choose to visualize the number of errors versus legitimate traffic using a graph rather than the numerical output of the Protocol Hierarchy tool.
- TCP Stream Graphs. Displays TCP traffic, including roundtrip, throughput and window scaling information. Select a TCP-based packet to enable this menu.
- IPv4 Statistics > Destination and Ports. Filters network traffic by destination identifiers, including IP addresses and port numbers. Recall that these port numbers are standardized, such as port 80 for HTTP or 443 for HTTPS.
- IPv4 Statistics > Source and Destination Addresses. Displays network traffic organized by IPv4 source and destination addresses, further narrowing the scope of investigation for traffic. This data is essential for understanding the relationship between two nodes, such as routers that exchange routing tables or proxies and the clients they serve.
Wireshark is also capable of dealing with IPv6 network traffic. The official Wireshark website offers extensive documentation.
3. Use packet captures to discover network devices
Another way to use protocol analyzers is to identify and document the devices communicating on the network. Network pros can categorize network participation in several ways, including the following:
- What hosts are on the network? The network capture shows source and destination MAC and IP addresses, clearly delineating what hosts are participating on the network. Compare this to network diagrams to ensure the expected devices are present.
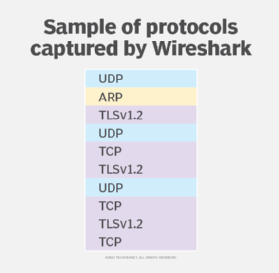
- What protocols are on the network? Do you have hosts on a particular segment using Trivial File Transfer Protocol? How do you know? A capture clearly identifies all traffic types, enabling you to investigate unknown or unexpected protocols.
- What applications are using the network? Related to the protocol identification mentioned above, identifying what applications exchange network information is useful for ensuring that firewall rules and packet filtering configurations are correct. You might also use these criteria to discover peer-to-peer BitTorrent or similar network abuses.
- What information is the client sending to the server? Display client requests to web, FTP or file servers, helping identify queries or processes that consume server resources.
- What information is the server sending to the client? Identify information sent to client devices to understand what the clients process. This information could include Ansible or other configuration management automation messages.
Wrap-up
Network professionals almost always approach protocol analyzers as security tools, whether as hacker tools used in eavesdropping attacks or as penetration testing utilities helpful for securing networks. However, they are also exceptional troubleshooting and network discovery instruments.
Wireshark is powerful and more user-friendly than tcpdump, but the latter is worth knowing for its simplicity and flexibility. Remember, you can always capture content with tcpdump and then open and analyze it using Wireshark's interface. Wireshark's reporting tools make it easy to communicate your findings to less technical stakeholders.
The following are three suggested ways to use protocol analyzers to investigate your network:
- Identify the types of protocols on your network.
- Analyze network performance.
- Discover network devices.
Any of these approaches will streamline your troubleshooting steps and provide a surprising amount of depth.