site reliability engineering (SRE)
What is site reliability engineering?
Site reliability engineering (SRE) is the application of scripting and automation to IT operations tasks such as maintenance and support. The goal of SRE is to swiftly fix bugs and remove manual work in rote tasks.
In some IT departments, the development team is split into developers and site reliability engineers. The latter may work with the developers to design and engineer software as well as with IT operations team members to manage and support the software.
Site reliability engineers seek to improve operating software while minimizing the work involved in its upkeep. They focus on automating as many tasks as possible to help operation experts provide strategic, higher-level work, such as planning a new deployment or creating a pipeline for faster product feedback.
How does site reliability engineering work?
Site reliability engineers play a key role in ensuring service-level agreements (SLA) requirements are met. SLAs provide the SRE team the level of reliability required of the software they work on. For example, 99% uptime gives the SRE team a 1% threshold for errors, bugs or downtime.
SREs also establish performance-oriented metrics, including the following:
- Service-level objectives (SLOs), which address site reliability.
- Service-level indicators (SLIs), which focus on detecting issues and anomalies.
Once SLOs are set, SLIs identify when system performance is out of sync with SLOs. SREs also establish an error budget, which is a window of time in which performance issues must be identified, accepted and rectified.
While this SLA structure is like that of any operations team, the primary difference is the role of SRE professionals. If the code written to automate operations tasks lets software services meet the agreed-upon level, the site reliability engineer can continue developing more code to further improve the software stack. However, if services and applications experience outages or lagging performance as identified by SLIs and compared to SLOs, then the engineer must fix the issues immediately before tackling other projects.
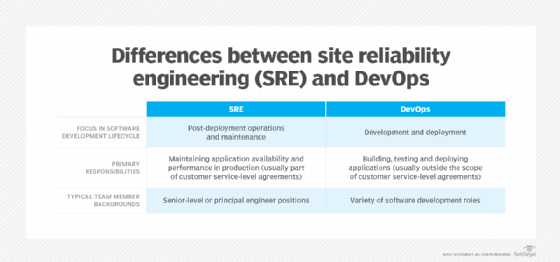
What is the difference between SRE and DevOps?
Site reliability engineering and DevOps are two approaches in software engineering that aim to improve the efficiency and reliability of software systems. They share some common goals, but there are some differences between the two approaches.
DevOps
DevOps is a set of practices that encourage collaboration among developers, operations and other software development stakeholders. DevOps teams typically lead software development efforts to create high-performance applications quickly and efficiently while maintaining quality. DevOps emphasizes continuous integration and delivery, rapid and frequent deployment cycles, and continuous monitoring of production systems.
Site reliability engineering
SRE complements DevOps by ensuring that resource optimization; network use; resource observability; reliability, availability and serviceability (RAS); and resilience are baked into the app. Essentially, SRE extends the principles of DevOps to operations, maximizing reliability through the use of automation, monitoring and continuous improvement processes.
SRE teams use a data-driven approach to analyze incidents, reduce risk and improve system reliability. Ideally, DevOps and SRE teams collaborate in all phases of the systems development lifecycle.
Why is site reliability engineering important?
Before the advent of numerous software development, management and maintenance software tools, many tasks associated with managing and maintaining production software systems were performed manually. Today, SRE professionals use various software tools to automate the performance and reliability of production systems. They improve overall software development, production, performance and maintenance activities throughout a system's lifecycle.
The SRE team works in multiple parts of a software app's lifecycle and workflows, including development, testing, production and the end user experience. It's also responsible for implementing performance tuning; using network resources to minimize latency; and helping with change management, application security and disaster recovery efforts.
Given its comprehensive presence, SRE is important to keep components working properly. It ensures a final software product and any new features added perform well, use minimal resources, and are reliable and user-friendly.
Who uses site reliability engineering?
IT organizations that develop and maintain large applications are ideal candidates for SRE expertise. These engineering teams are more likely to be included in software development teams when the apps are large, complex, resource intensive and mission critical.
Their role is to ensure applications released into production are secure, reliable, and easy to manage and maintain. Small and medium-sized organizations may have one site reliability engineer on their development teams, but given the skills and expertise needed to be one, salary requirements might be prohibitive.
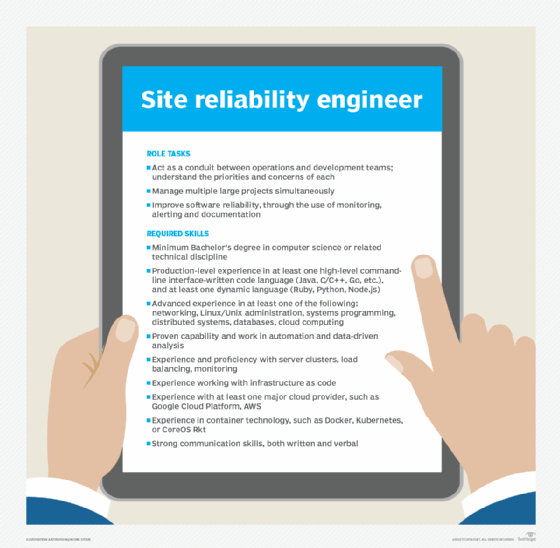
Site reliability engineering skills
Typical qualifications for SRE positions include the following:
- Bachelor of science in computer science or a related discipline or equivalent experience.
- Knowledge of container technology, web services, databases and related IT infrastructures.
- Expertise in using scripting languages.
- Experience with platforms and operating systems, such as VMware ESXi and Linux.
- Thorough familiarity with networking.
- Experience in system administration and cloud computing.
- Excellent interpersonal skills to work successfully with both operations engineers and software developers.
The history of SRE
The site reliability engineer role relies on a management principle more than a century old: the people who create something should be equally responsible for ensuring its continual success. Google is credited with applying this to website management in 2003 when they tasked Benjamin Treynor Sloss, then vice president of engineering, to lead a team of software engineers to create and maintain a production IT environment. The goal was to keep Google's websites running with the highest level of RAS.
Treynor's team spent half its time on operations to gain a better understanding of software in production. Treynor saw SRE practices as a way to help software engineers structure the operations functions related to the software they developed, effectively creating a no operations environment. Companies employing this method include Dropbox, Mozilla, LinkedIn and Netflix.
Learn more about what a site reliability engineer does in this profile of one such professional.