The startup BI vendors to watch in 2021 are those companies attempting to extend data analysis beyond data scientists and trained analysts to ordinary business users.
Analytics startups and market trends aren't 100% linked, but often the confluence of the two is what separates the new vendors that are able to attract customers and make a lasting impact from the litany that quickly fade away.
Data storytelling is one emerging trend in business intelligence. It's no surprise, therefore, that among the analytics startups to watch in 2021 are vendors whose software automatically develops narratives to help users understand their data.
Process automation is another emerging trend, and startup vendors that are able to automate aspects of the analytics process are among those expected to draw interest over the next year.
Meanwhile, differentiation is crucial for startups attempting to gain a foothold in an established market, and it is one of the key factors venture capital firms look for when backing new companies.
"There's got to be an outstanding founding team that has deep domain expertise," said Gil Dibner, founder and general partner of Angular Ventures, when asked what helps one startup vendor stand out from the rest. "The second [criteria] would be some kind of defensible barrier to entry. And then a third one is a huge market, a huge mega trend."
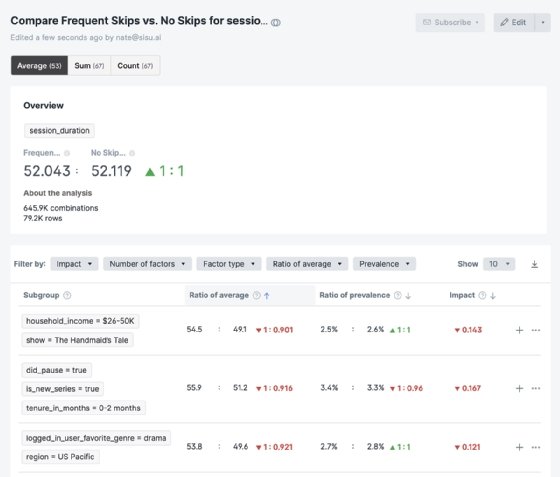
A Sisu dashboard displays changes in an organization's key metrics.
Data storytelling brings analytics to the masses
The great challenge analytics has been unable to overcome is making it accessible to everyone. Despite the advent of data visualization platforms over the last decade and more recently advances in augmented intelligence features like natural language processing, analytics has largely remained the domain of trained data analysts.
Data storytelling, however, might finally be the technology that opens analytics to the masses. By automatically generating explanations of an organization's data -- telling the story of the data under analysis -- anyone can work with data.
Studies have shown that only 20% to 40% of employees within most organizations use analytics as part of their jobs. Data storytelling could make that close to 100%, according to Dave Menninger, research director of data and analytics research at Ventana Research.
Founded in 2015 and based in Paris, Toucan Toco combines embedded BI and data storytelling.
The vendor's platform is designed to communicate insights to business users who don't have trained data literacy skills. In addition, its applications can be designed without coding and then embedded throughout the analytics pipeline to deliver narrative insights throughout users' workflows rather than just in the final stage of their workflow.
In the five years since its founding, according to its LinkedIn page, Toucan Toco has grown from four to 115 employees and it now has 140 customers, including Renault and Heineken.
"They've done a really good job of creating a much simpler interface, and an experience based around data stories," said Donald Farmer, principal of TreeHive Strategy. "If you look at vendors like [Microsoft] Power BI, Tableau, Qlik, Yellowfin, they have data storytelling as a feature, but this is a product built around data storytelling."
Narrative Science launched in 2010, so it is far from a startup, but the analytics company overhauled its platform in 2019 to center on data storytelling.
The vendor introduced Lexio shortly before the start of 2020 and updated the platform in November. Lexio connects to an organization's data storage platform -- whether on premises or in the cloud -- and using augmented intelligence and machine learning capabilities, queries the data and returns narrative stories built around the data.
"Lexio is almost like a startup within Narrative Science," Farmer said. "It's fascinating that a company can take their technology and think of completely new ways of doing things."
In particular, Farmer continued, what's exciting is that Lexio isn't a tool that merely explains what's in a chart or graph but becomes the user's entire analytics platform for interacting with their data.
Automation to eliminate repetition
While data storytelling broadens the reach of analytics beyond trained data scientists and analysts, process automation aims to free data scientists and analysts from the repetitive data management tasks that often dominate their time.
One of those tasks is monitoring data sets for any changes, and that's what Sisu Data's platform does for customers.
The vendor, based in San Francisco and founded in 2018, emerged from stealth in late 2019 with $66.7 million in venture capital funding. Its platform uses machine learning and statistical analysis to automatically monitor an organization's key performance indicators (KPIs) and recognize any changes. In addition, it delves into the change and delivers an explanation for why it occurred.
That ability to explain why a metric changed -- and do so quickly -- was a key differentiator for Sisu, when it first went to market, said Doug Henschen, principal analyst at Constellation Research. In the time since then, the vendor has added tools to quickly diagnose the results of A/B and other comparative tests and do faster text analysis.
And it's that automatic monitoring and subsequent automatic analysis that drew Pathstream to Sisu.
San Francisco-based Pathstream offers web-based education programs that help students prepare for jobs in emerging fields, including data analytics and digital marketing. It partners with technology vendors like Salesforce and Tableau, as well as educational institutions to craft and deliver its programs.
Some people on our team are very fluent in data, and some less so, and [Sisu] allows them to think through the problems and solutions without having to know how to approach data analysis.
Eleanor CooperCEO, Pathstream
Founded in 2018, the company's data includes information collected prior to a student's enrollment -- among them demographics, prior education, and their goals and motivation for being in the programs. In addition, data is collected as students go through the programs -- what they click on, how long they spend on lessons, how long they spend in labs, and, of course, how they perform.
By June 2020, Pathstream had more data on hand than it could manage on its own.
"We collect a lot of data, and I don't have the time or resources to look at every driving factor and what may be correlated with what else," said Eleanor Cooper, CEO of Pathstream. "As a young company, we have tons of competitive disadvantages, but we're nimble, and being able to use data to find non-obvious trends gives us the ability to capitalize on our nimbleness."
Pathstream uses Tableau and Mode Analytics to develop dashboards, but it needed a platform that could automate monitoring and data analysis, and do so without writing code.
"In terms of being able to throw in your entire data lake and have [a technology] instantly pop up with explanations about the highest impact drivers and KPIs, it's something I haven't seen anyplace else," Cooper said. "It's an instant way to drill into what's moving the needle."
Six months after starting with Sisu, Cooper said she spends substantially less time parsing data -- essentially manually reading through applications and reports -- to discover correlations and other information about Pathstream's students.
One insight Sisu uncovered is that during the pandemic, applicants who discussed wanting to support their families or be proud of their accomplishments on their applications were less likely to enroll or complete the program because they were stretched too thin. It helped Pathstream be proactive and retain students who might otherwise drop out or never get started.
"Sisu allows so many people to become data-driven and a data analyst, in some ways," she said. "It builds their confidence. Some people on our team are very fluent in data, and some less so, and this allows them to think through the problems and solutions without having to know-how to approach data analysis."
Incorta, founded in 2013 and based in San Mateo, Calif., is another vendor whose tools automate data management tasks that otherwise have to be done manually.
While Sisu monitors KPIs and automates analysis, Incorta automatically takes data from multiple sources, consolidates it and prepares it for analysis.
"Incorta and Sisu are both interesting," Ventana Research's Menninger said. "Both are about automation. Incorta is automating the process of making data from source systems available for analysis, reducing or eliminating the need for data engineering activities. Sisu is automating the analysis and ongoing monitoring of KPIs using AI/ML -- statistical process control for organizational KPIs."
The venture capital perspective
When looking to identify analytics vendors that have just emerged from stealth that may make up the next wave of innovators, follow the money.
Vanessa Larco is a partner specializing in new technology investments at New Enterprise Associates (NEA), a venture capital investment firm based in Chevy Chase, Md.
In late 2019, her firm was one of the investors in Sisu's Series B funding. Tableau and Databricks, meanwhile, were among other analytics vendors NEA identified as startups with big potential.
Datafold is one analytics startup that impressed Larco over the past year.
The vendor, founded in 2020 and based in San Francisco, offers a platform that monitors data quality. As the amount of data that organizations collect grows exponentially, thanks to such developments as IoT and 5G, it becomes more difficult for them to monitor their data and ensure its quality. And Datafold is designed to monitor applications to give administrators visibility into key metrics and identify errors and anomalies.
"Datafold is a very early stage investment we made this year," Larco said. "They help analysts with data quality and support the trend of the analytics engineer -- analysts wanting to have better workflows and best practices, similar to the ones that exist in software development."
Another startup that intrigues Larco is Census, a vendor founded in 2018 and based in San Francisco.
After securing seed funding in 2020, Census emerged from stealth in 2020 with a platform that enables users to automatically synchronize their customer data to get a complete view of each customer as an individual and subsequently tailor their marketing efforts toward those customers as individuals.
NEA is not an investor in the vendor, but Larco said she thinks Census has an innovative platform to enable marketing campaigns.
"I am very excited by Census," Larco said. "I think their product offering and value proposition is resonating very strongly. It's very early, but I think this is where the future of data/360 customer view is going."
Larco additionally mentioned more established vendors OmniSci and Metabase. OmniSci, founded in 2013, specializes in advanced analytics, while Metabase, founded in 2014, is an open source BI platform already used by over 25,000 companies, according to Larco.
Angular Ventures -- Dibner's firm -- meanwhile, recently took part in the launch of Firebolt, a cloud data warehouse vendor. While not specializing in analytics, it hopes to compete with established cloud data storage platforms, including Snowflake, Amazon Redshift, Google BigQuery and Microsoft Azure to enable faster and easier data analysis.
Touting its speed as a differentiator, Firebolt raised $37 million in its initial funding round. Snowflake, comparatively, raised just $5 million its Series A round in 2012.
"We wrote a very large check relative to our firm," Dibner said. "It's our largest position of any company that we've invested in so far."
Outside the box
While many analytics startups are part of emerging trends, not all fit neatly into a few of the most popular ones. Some are doing something completely new or innovating on capabilities only a few vendors have delivered before.
For example, ZenOptics, founded in 2015 and based in San Jose, Calif., enables customers to essentially build an analytics catalog.
Organizations have built data catalogs in the past, enabling them to find and manage data from disparate sources such as their ERP software and human resources and finance systems.
Now, as more organizations develop data-driven cultures, they have a growing number of analytics artifacts -- charts, dashboards and other data visualizations -- developed in different applications. Many large organizations, for example, use different BI tools in different departments, one using SAP or BusinessObjects, for example, and others using Power BI or Tableau.
ZenOptics enables organizations to catalog those analytics artifacts developed in different applications in a single location so they can be easily searched.
It enables end users to see who may be using what information and potentially collaborate, and IT personnel to understand usage by seeing what reports and dashboards are most valuable and should be prioritized.
"That's a great way for business users to be able to access all the analytics in their organization," Farmer said. "It's almost like a new space which is developing -- it's not just a new product, but it's actually a new category of products."
Grid is another vendor Framer believes has a bright future but doesn't fit neatly into an existing trend.
Founded in 2018 and based in Reykjavik, Iceland, Grid -- like fellow startups Kloud.io and Sigma Computing -- uses a spreadsheet interface to enable users to work in a familiar format. Grid, however, doesn't replace existing spreadsheets like Excel and Google Sheets.
Instead, users are able to take the work they've done in Excel and Google Sheets and, without having to write code, transform the spreadsheets into visual, interactive web documents where they can explain their analysis and subsequently share their work within their organizations.
As others consume and edit the web document, the original spreadsheet remains under the governance of its developer without risk of accidental change from others.
"They're absolutely fascinating," Farmer said. "What they've done that's so interesting is take something as familiar as a spreadsheet, something people know inside-out, and turn it into a way for communicating."
In a sense, communication is what each of the analytics startups to watch addresses.
The trends boil down to ease of use in some form, and enabling more users to make analytics part of their workflows. The startups that have the potential to have a lasting effect, meanwhile, are the ones that most effectively lower the barriers to entry and succeed in extending the reach of analytics.