New Relic adds SRE features, preps security offering
A New Relic observability update this week reflects the crucial role of SREs in microservices architecture, and there are plans to align with the firm's DevSecOps ambitions.
As enterprises increase their emphasis on the resiliency of distributed computing systems, site reliability engineering practices play a crucial role, prompting vendors such as New Relic to expand observability tools accordingly.
Service Level Management (SLM), a new feature for the New Relic One platform, became generally available this week at no charge to existing customers. It provides a framework for site reliability engineering (SRE) teams to configure service level indicators (SLIs) and service-level objectives (SLOs), automatically set baselines and track the reliability of microservices according to these performance indicators.
A company spokesperson also said that New Relic plans to announce a security offering this year but did not provide further details. FutureStack, the company's annual user conference where it typically makes major product updates, is scheduled for May.
New Relic SLM beta testers said the vendor's update this week reflects how the transition to a microservices architecture has broadened the role played by both observability tools and SREs at their companies, and welcomed the possible addition of security monitoring to that mix. SREs have also begun to play an expanded role in DevSecOps environments.
Ultimately, bringing multiple types of monitoring and measurement to capture user experience, rather than track the raw performance of individual infrastructure components, is what makes microservices different from monoliths, observability different from monitoring and SREs different from traditional sysadmins, said one New Relic SLM early adopter.
Observability helps us to understand the state of a distributed system by looking at all the data it generates, not just individual [resources].
Andrew MyersSenior SRE manager, Zip.co
"Monitoring is very helpful when the failure modes are well understood, like exhausting finite system resources like memory or threads," said Andrew Myers, senior SRE manager at Zip.co, an Australian online payments company. "Observability helps us to understand the state of a distributed system by looking at all the data it generates, not just individual [resources]."
Observability tools enter cutthroat consolidation phase
At least some enterprises have begun to consolidate observability tools with New Relic, adding logs and distributed traces to New Relic's traditional application performance monitoring (APM) tools as they evolve, as well as metrics and data aggregation from third-party tools such as Prometheus, and phasing out competitive tools such as Splunk and Grafana as a result.
However, some enterprises are making consolidation choices that favor other vendors, and New Relic is playing catch-up in catering to SREs -- two of its principal competitors, Dynatrace and Datadog, have had SLI and SLO monitoring features since 2020 and 2019, respectively.
These competitors also cover an entire category of monitoring in IT security and DevSecOps that New Relic has yet to tackle. The observability market is ripe for further attrition and consolidation as users continue to reduce the number of IT management tools they use, including for security, and New Relic must keep pace with competitors, including those in security monitoring, to succeed long term.
"[Adding application security tools] would make good sense as they continue to target the software delivery lifecycle and developers more," said Stephen Elliot, an analyst at IDC. "Code scanning is an interesting area, as are vulnerability assessments for developers."
New Relic is also still emerging from a major upheaval in May 2021, when it appointed a new CEO and overhauled its product portfolio to create New Relic One, a unified observability platform. According to the company's latest earnings report, its revenue has grown steadily since then, with 14,600 customers as of its fiscal third quarter, which ended in January.
However, as it navigates the innovator's dilemma, which is also creating turbulence for enterprise IT vendors Splunk and ServiceNow, New Relic has yet to regain profitability, forecasted relatively flat revenue in its fiscal fourth quarter, and doesn't expect profitability until well into fiscal 2023.
SREs, observability create harmony from chaos
SREs have played the role of facilitator as microservices matured at one SLM early adopter company, creating a centralized observability stack with New Relic and using it to orchestrate communication among developers, platform engineers and product teams.
Stefan Kolesnikowicz
"In a monolithic environment, reliability was only on the SRE team -- we were the only ones who cared if stuff broke in production," said Stefan Kolesnikowicz, principal SRE at Achievers, an employee recognition software maker based in Toronto.
As Achievers' culture and microservices deployments on Google Cloud Platform grew, "everyone became responsible for reliability," he said. The distributed nature of microservices, by definition, forces collaboration among the teams that develop and manage them, and their complexity can't be handled by any single team alone.
The Achievers SRE team created a developer self-service portal called Abattoir, in a nod to the oft-cited "cattle vs. pets" analogy that arose with the highly automated, ephemeral infrastructure that underpins fast-changing microservices environments.
New Relic SLM will slot into Abattoir to let software engineers and product teams configure and track SLIs and SLOs for the services they manage, thanks in part to a new integration with Terraform that automatically creates objects in the New Relic observability database behind the scenes.
"We have a checkbox for that -- basically, engineers just say, 'Yes, I want this,'" Kolesnikowicz said. "That's all then translated from YAML, which engineers write it in, and pushed through Terraform, [which] talks to the New Relic API, which creates all of those objects in New Relic."
All of this reflects how system reliability has risen to the top of the priority list at Achievers, Kolesnikowicz said, as it has among many enterprises with microservices going mainstream.
"We're trying to be more on the strict side, so if your error budget is depleting, that's your highest priority, to get your reliability up before you can release new features and introduce more risk to our platform," Kolesnikowicz said. "[New Relic SLM] is going to give us better insight into how a system is performing and its impact on the rest of the platform, and the integrations with the product will let them see, 'Hey, you're slipping on your error budget.'"
SLM early adopters would like to see built-in alerting around error budgets added to the tool in a future release. They can use the New Relic query language to configure custom alerts as error budget burn rates reach certain thresholds, but it would be easier if that alert came prepackaged with SLM.
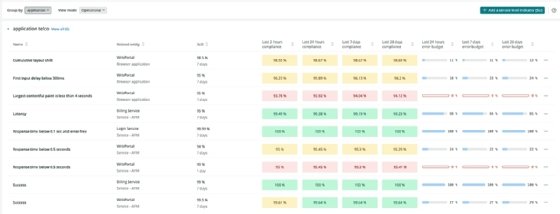
New Relic's Service Level Management is a framework for configuring SRE metrics such as SLIs and SLOs.
"It would also be great to have some smarts to help teams decide on realistic targets for service levels based on the historical data we have as a baseline," Zip.co's Myers said. "That has been something we've needed to coach our teams on internally."
Another potential refinement for SLM in the future would be expanded support for the Prometheus metrics that Achievers monitors in its individual Kubernetes clusters via the Istio service mesh, according to Kolesnikowicz. New Relic One already aggregates Prometheus metrics for other uses, but it hasn't been built in to SLM yet.
"If you're familiar with the SRE book, [it says] you can move measurement closer to the user to improve its quality," he said, referencing the seminal Google Site Reliability Engineering manual. "Today, we measure [SLIs] on the server side -- we want to measure it on the load balancer, which would be in our Istio instance."
Error budget burn rates and Prometheus metrics support are both on the vendor's short-term roadmap for SLM, a New Relic spokesperson said.
Beth Pariseau, senior news writer at TechTarget, is an award-winning veteran of IT journalism. She can be reached at [email protected] or on Twitter @PariseauTT.
Dig Deeper on Systems automation and orchestration


 Stefan Kolesnikowicz