
Getty Images
Understand the k-means clustering algorithm with examples
The k-means clustering algorithm groups similar objects or data points into clusters. This approach is popular for multivariate numeric data.

As data science continues to evolve, the k-means clustering algorithm remains a valuable tool to uncover insights and patterns within complex datasets. Understanding the elbow method and the silhouette method helps you make an informed decision when you apply the k-means algorithm to real-world datasets.
Clustering is the act of grouping similar objects or data points. It's an essential technique in data science and machine learning. The k-means clustering algorithm is a widely used approach thanks to its simplicity and effectiveness in analyzing multivariate data.
K-means clustering is the process of creating a specific number of clusters from a set of data points. The clusters are tightly grouped together, which means the data within those clusters is as similar as possible. In the name, k refers to the number of clusters. Means refers to the fact that the clusters are located around a centroid, which is the average or mean of the cluster.
When should you use the k-means clustering algorithm?
K-means is a relatively fast clustering algorithm, and it is suitable for large datasets. This method is ideally used for multivariate numeric data.
An example where the k-means algorithm is a good fit is clustering RGB values. The data is in the form, where R, G and B represent the intensity of red, green and blue of a single color. There are 16 million different RGB combinations, but you can use the k-means algorithm to reduce a set of RGB values down to a smaller number. For example, if you choose a k value of 256, it will create 256 clusters of similar colors. You can map the 256 clusters to a single color. Then, you can reduce the overall set to only 256 colors.
The challenge of k-means clustering algorithm
K-means can't process categorical attributes because there is no way to incorporate the non-numerical data into the algorithm it uses.
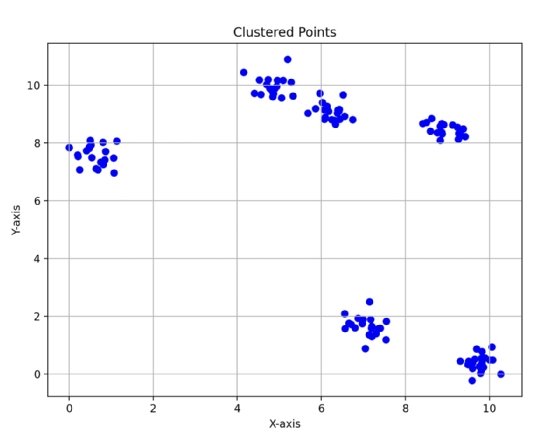
Data that contains irregularly shaped clusters is poorly suited for k-means. In Fig. 1, you can see how there are distinct circular clusters that exist in the data. K-means clustering is well suited for data that is clustered in spherical shapes because the algorithm computes a centroid as the mean of all points in each cluster.
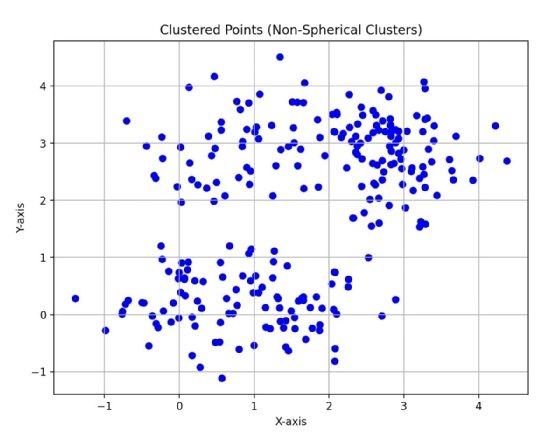
In Fig. 2, you can see two clusters, but the data points are not as tightly clustered as Fig. 1, and they are not quite spherical. It is harder for k-means to capture what you can see as two clusters of data because its algorithm is biased towards spherical clusters of data.
Using the elbow method to choose k value
It is important to choose the proper k value to be successful when you apply the k-means algorithm. If the value of k is too small, clusters will contain points that would be better suited in distinct clusters. If the value of k is too large, clusters will be split unnecessarily. This leads to distinct clusters which are better represented as a single cluster.
To choose a k value using the elbow method, you need to run the k-means algorithm many times with different values for k.
After you run the algorithm on the data with a k value of 1 through 10, calculate a value that tells you the cluster density for each run. The sum of squared distances between each point and its assigned cluster centroid will calculate and give you a representation of how tightly grouped the clusters are. This is commonly referred to as the within-cluster sum of squares (WCSS). This value is plotted against the k value, which gives you a graph that looks like Fig. 3.
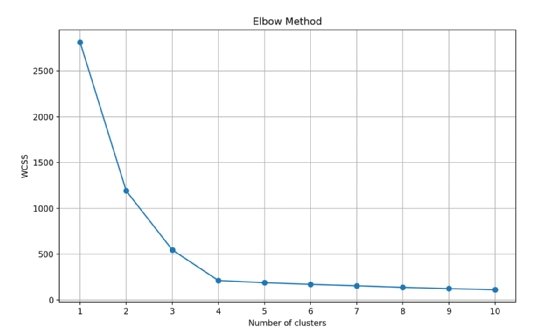
Imagine the plotted values are an arm and the point where the values make a sharp change is the elbow of the arm. The ideal k value is where the WCSS value starts to level out relative to the number of clusters. In the case of Fig. 3, a k value of 4 or 5 would be ideal.
Using the silhouette method to choose k value
The silhouette method finds the number of clusters where the data points are best placed within clusters and are well-separated from other clusters.
For each data point, measure the average distance from the data point to other points in the same cluster. This represents how well the data point fits into its own cluster. Let's call this value b.
For each data point calculate the smallest average distance from the data point to points in a different cluster. This represents how distinct the data point is from other clusters. We'll call this value c.
Plug the two values into the following formula:
s = (c − b) ÷ max(b, c)
From this formula, you get a silhouette score. This allows you to judge each point for optimal clustering.
If b is much smaller than c, the point is well-clustered, and it gets a score close to 1. If b and c are similar, the point is on the border of two clusters, and it gets a score around 0. If b is much larger than c, it might be in the wrong cluster, and it gets a score close to -1.
To get an idea of the accuracy of the overall clustering results, average the silhouette scores of all data points for each value of k. The optimal k value is that which gives the highest average silhouette score. The highest average silhouette score tells you the number of clusters or k value that gives the best overall fit for the data.
An example of the k-means clustering algorithm
You can implement the k-means algorithm in Python. First, you will need to define a function to calculate the Euclidean distance and then create some random data.
# Function to calculate Euclidean distance
def euclidean_distance(x1, x2):
   return np.sqrt(np.sum((x1 - x2) ** 2))

# Generate sample data
X = np.random.randn(300, 2)
Next, create a class KMeans. This will contain the k-means algorithm implementation.
# KMeans class
class KMeans:
   def __init__(self, k=3, max_iters=100):
       self.k = k
       self.max_iters = max_iters
The __init__ method will set the k value to be used, as well as a max_iters value that defaults to 100. The default is important to limit the maximum number of iterations you will run the algorithm for.
# Initialize centroids as randomly selected data points
def initialize_centroids(self, X):
   centroids_idx = np.random.choice(X.shape[0], self.k, replace=False)
   return X[centroids_idx]
You need a function for the algorithm to randomly select cluster centroids. The initialize_centroids function takes a set of data points and randomly chooses k points as centroids to use for clustering.
After the random centroids have been selected, you can then assign points to clusters with the following assign_clusters method. This takes the data points and centroids as arguments.
# Assign each data point to the nearest centroid
def assign_clusters(self, X, centroids):
   clusters = [[] for _ in range(self.k)]
   for i, x in enumerate(X):
       distances = [euclidean_distance(x, centroid) for centroid in centroids]
       cluster_idx = np.argmin(distances)
       clusters[cluster_idx].append(i)
   return clusters
To assign a data point to a cluster, calculate the Euclidean distance for the point to each of the centroids. The data point assigns itself to the cluster whose centroid has the smallest Euclidean distance from the data point.
After you assign all data points to clusters, the centroids update to the mean of all points assigned to the cluster. Then, the update_centroids method takes the data points and clusters as arguments, iterates over the clusters to calculate the mean value -- the true center of the cluster -- and returns those values as centroids of each cluster.
# Update centroids by taking the mean of all points assigned to the centroid
def update_centroids(self, X, clusters):
   centroids = np.zeros((self.k, X.shape[1]))
   for i, cluster in enumerate(clusters):
       cluster_mean = np.mean(X[cluster], axis=0)
       centroids[i] = cluster_mean
   return centroids
Next, check to see if the true centroids are similar to the randomly assigned centroids from the beginning of the algorithm. If the centroids are close to each other, the clusters have been properly created and contain data points that are closely located to their centroids.
In this case, the k-means clustering algorithm is finished. If the centroids are not similar, begin the entire process again and start back at the beginning where you assigned random data points as centroids.
Here's what everything looks like under the fit method of our KMeans class which uses the other methods you have used.
def fit(self, X):
   self.centroids = self.initialize_centroids(X)
   for _ in range(self.max_iters):
       clusters = self.assign_clusters(X, self.centroids)
       prev_centroids = self.centroids
       self.centroids = self.update_centroids(X, clusters)
       # If centroids don't change much, break
       if np.allclose(prev_centroids, self.centroids):
           break
Matthew Grasberger is a DevOps engineer at Imperfect Foods. He has experience in test automation, DevOps engineering, security automation and open source mobile testing frameworks.