What is clustering in machine learning and how does it work?

Clustering is a data science technique in machine learning that groups similar rows in a data set. After running a clustering technique, a new column appears in the data set to indicate the group each row of data fits into best. Since rows of data, or data points, often represent people, financial transactions, documents or other important entities, these groups tend to form clusters of similar entities that have several kinds of real-world applications.
Why is clustering important?
Clustering is sometimes referred to as unsupervised machine learning. To perform clustering, labels for past known outcomes -- a dependent, y, target or label variable -- are generally unnecessary. For example, when applying a clustering method in a mortgage loan application process, it's not necessary to know whether the applicants made their past mortgage payments. Rather, you need demographic, psychographic, behavioral, geographic or other information about the applicants in a mortgage portfolio. A clustering method will then attempt to group the applicants based on that information. This method stands in contrast to supervised learning, in which mortgage default risk for new applicants, for example, can be predicted based on patterns in data labeled with past default outcomes.
Since clustering generally groups input data, it can be very creative and flexible. Clustering can be used for data exploration and preprocessing, as well as specific applications. From a technical perspective, common applications of clustering include the following:
- Data visualization. Data often contains natural groups or segments, and clustering should be able to find them. Visualizing clusters can be a highly informative data analysis approach.
- Prototypes. Prototypes are data points that represent many other points and help explain data and models. If a cluster represents a large market segment, then the data point at the cluster center -- or cluster centroid -- is the prototypical member of that market segment.
- Sampling. Since clustering can define groups in the data, clusters can be used to create different types of data samples. Drawing an equal number of data points from each cluster in a data set, for example, can create a balanced sample of the population represented by that data set.
- Segments for models. Sometimes the predictive performance of supervised models -- regression, decision tree and neural networks, for example -- can be improved by using the information learned from unsupervised approaches such as clusters. Data scientists might include clusters as inputs to other models or build separate models for each cluster.
For business applications, clustering is a battle-tested tool in market segmentation and fraud detection. Clustering is also useful for categorizing documents, making product recommendations and in other applications where grouping entities makes sense.
Types of clustering algorithms
There are many types of clustering algorithms, but K-means and hierarchical clustering are the most widely available in data science tools.
K-means clustering
The K-means clustering algorithm, choose a specific number of clusters to create in the data and denote that number as k. K can be 3, 10, 1,000 or any other number of clusters, but smaller numbers work better. The algorithm then makes k clusters and the center point of each cluster or centroid becomes the mean, or average, value of each variable inside the cluster. K-means and related approaches -- such as k-mediods for character data or k-prototypes for mixed numeric and character data -- are fast and work well on large data sets. However, they usually make simple, spherical clusters of roughly the same size.
Hierarchical clustering
If you're seeking more complex and realistic clusters of different shapes and sizes, and don't want to pick the k before starting the analysis, hierarchical clustering might be a better choice. Hierarchical clustering accommodates a divisive approach: start with one big cluster, break that cluster into smaller ones until each point is in its own cluster and then choose from all the interesting clustering solutions in between.
Another option is an agglomerative approach, in which each data point starts in its own cluster. Combine the data points into clusters until all the points are in one big cluster and then choose the best clusters in between. Unfortunately, hierarchical clustering algorithms tend to be slow or impossible for big data, so a k still has to be chosen to arrive at the final answer.
One of the hardest parts of clustering is choosing the number of clusters that best suits the data and application. There are data-driven methods to estimate k, such as silhouette score and gap statistics. These quantitative formulas provide a numeric score that helps choose the best number of clusters. Domain knowledge can also be used: For example, a project has enough budget for 10 different marketing campaigns, so commercial concerns dictate 10 is a good number of clusters or experienced marketers who have worked in a certain vertical for a long time know the best number of segments for the market. Combining quantitative analysis and domain knowledge often works well, too.
Cluster profiling: How do you know your clusters are right?
In clustering, answers are usually validated through a technique known as profiling, which involves naming the clusters. For example, DINKs (dual income, no kids), HINRYs (high income, not rich yet) and hockey moms are all names that refer to groups of consumers. These names are usually determined by looking at the centroid -- or prototypical data point -- for each cluster and ensuring they're logical and different from the other discovered prototypes.
Visualization is also a key aspect of profiling. Clusters can be plotted to ensure they don't overlap and that their arrangement makes sense. For example, clusters for very different market segments should appear visually distant in a plot.
What do you do when you don't like the clustering results?
If the clustering results are unsatisfactory, try a different number of clusters, change the settings for the clustering algorithm or use another clustering technique, such as BIRCH, DBSCAN, density-based, distribution-based, grid-based or mean shift.
No matter the number of clusters, algorithm or settings used, expect clustering to be an iterative process. It requires a sensible mathematical approach, profiling the results, consulting with domain or business experts, and trying until a workable set of clusters is found.
Clustering use cases
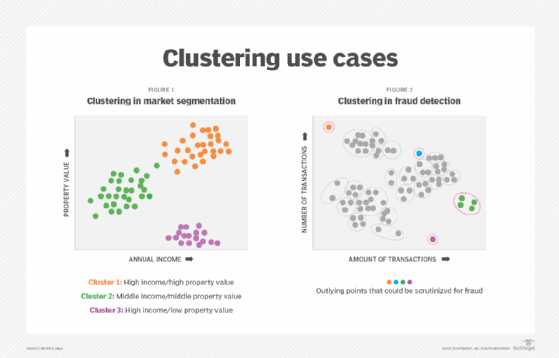
Clustering has many business applications. Two of these use cases are explained below and illustrated in Figure 1 and Figure 2 in the graphic titled "Clustering use cases."
Market segment application
For a data set of customers in which each row of data -- or data point -- is a customer, clustering techniques can be used to create groups of similar customers. Known as market segments, these customer groups can improve marketing efforts.
Figure 1 uses data pertaining to consumers' income and property value and K-means clustering to find three larger, roughly circular and similarly sized clusters within that market.
Cluster 1 appears to be a group of affluent consumers who own homes -- perhaps some DINKs. Cluster 2 likely represents middle-class homeowners -- probably some hockey moms and dads. Cluster 3 contains higher income consumers who don't appear to own homes -- HINRYs in many cases.
One of the more common applications of market segments is to optimize the money spent on marketing. For example, it probably doesn't make sense to send grocery coupons to Clusters 1 and 3 because they're unlikely to use them. On the other hand, premium co-branded credit card offers are likely wasted on Cluster 2 because they don't want the annual fees. With this knowledge of market segments, marketers can spend their budgets in a more efficient manner.
Fraud and detection application
Another common use case involves a data set of financial transactions in which each row is a financial transaction.
Figure 2 illustrates a hierarchical clustering solution for fraud detection applications. It contains smaller clusters of various shapes and sizes based on data about financial transactions. Two data points in orange and purple represent single individuals that don't fit into the larger clusters of transactions.
The blue data point is an outlying point of a larger cluster, and the green data point is an outlying cluster of transactions. These data points and clusters don't directly indicate fraud -- they could be associated with wealthy individuals or simply people that don't behave like other people. However, this clustering solution does provide a map for fraud case workers. Organizational resources will likely be better spent examining the highlighted points and clusters for fraud versus the transactions that fit neatly into larger and more central clusters.