Alteryx 2018.3 gives users new data visualization options
The latest version of Alteryx's data preparation and analytics software adds new visualization capabilities -- something that beta user Voxx Analytics says was needed.
The general release of Alteryx 2018.3 is now available, bringing with it more data visualization tools in an effort by Alteryx Inc. to give users of the data preparation and analytics platform a broader set of visualization capabilities.
The quarterly update became generally available on Aug. 28. It also adds other functionality to the Alteryx Analytics platform, including a workflow caching feature and a Python tool that will allow developers to write to Jupyter Notebook. In addition, Alteryx 2018.3 offers faster performance, more server management options and increased support for the Spark processing engine.
For users, the highlights of the release are likely to be the additional visualization tools and the caching capability. The need for better data visualization is particularly acute. While Gartner ranked Alteryx among the leading vendors in its 2018 Magic Quadrant report on data science and machine learning platforms, it faulted the company for reporting and visualization capabilities that "remain comparatively weak."
An increased focus on visualization
Alteryx 2018.3 clearly aims to address the visualization gap by expanding an embedded collection of tools called Visualytics, which Alteryx last August.
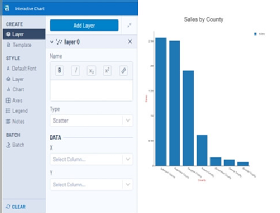
Following user requests for more, Alteryx has added a tool for building and sharing interactive charts and graphs that resulted from a 2017 partnership deal with visualization vendor Plotly. Alteryx users can now also combine multiple interactive charts together and share them with other users for collaborative analysis, said Greg Davoll, vice president of product marketing at the vendor, based in Irvine, Calif.
The Visualytics updates in Alteryx 2018.3 include a tool for designing interactive charts.
Meanwhile, the caching tool enables users to create caching points in the analytics workflow process. If the process is stopped, it will be restarted from the caching point, without the need to completely start over. That can help reduce processing times, as it has done for Alteryx user Voxx Analytics.
A Garden Grove, Calif., company that provides what it calls influence analytics services to help companies hone their marketing outreach efforts, particularly in the pharmaceuticals and life sciences industries, Voxx Analytics deployed Alteryx 2018.3 as part of the beta program for the release.
Ryan Peeler, the company's director of network analytics, said his team uses the Alteryx software to automate much of the name disambiguation process in analyzing data from social networks. Peeler added that the caching tool has already saved him "a ton of time" on data preparation and analytics processing jobs.
"Once I've pulled data once for a use case, I don't need to keep downloading it," he said. All that data now gets cached, "so the next time I run it, it picks up right where I left off."
Still room for more improvement
The Visualytics enhancements are also of interest to Peeler, who said they have made it easier for him to create data visualizations for customers. Still, while he likes where Alteryx has gone with Visualytics thus far, he noted that if he could make a change to Alteryx's software, it would be to further the platform's visualization capabilities even more.
Putting in visuals that allow customers to explore data sets has particular positive connotations to us.
Ryan Peelerdirector of network analytics at Voxx Analytics
For example, Peeler said he would like to be able to export data visualizations from Alteryx to other analytics and reporting platforms, so they could be shared with corporate clients more easily. "Putting in visuals that allow customers to explore data sets has particular positive connotations to us," he said.
Donald Farmer, principal of analytics consulting firm TreeHive Strategy, said the Visualytics components of Alteryx 2018.3 are notable enhancements.
"Visualytics recognizes what is too often overlooked in the data analysis user experience: that data preparation and analysis are two sides of the same coin," Farmer said. "These are really not separate processes. You prepare data with an analysis in mind, and as you develop the visualization or interpretation, you discover ways in which the data must be further prepared or refined to improve the analysis."
The integrated capabilities provided by Alteryx are particularly useful for "data artisans, who are working hands-on with the data and not visualizing at the end of some other process," Farmer continued. He also described the caching feature as "a significant enhancement for advanced users," saying it will help ease the hassles of developing complex data flows.
Pricing in question
However, Farmer negatively noted the Alteryx platform's pricing model, which charges users of the Alteryx Designer desktop tool an extra $6,500 per year for a feature that allows them to schedule analytics workflows and automate the generation of reports. That's on top of the $5,195 annual base cost per user for the Designer software. "In the 21st century, that's like selling a car with a hand crank and charging extra for an electric starter," Farmer said.
As for what users might expect beyond the Alteryx 2018.3 update, Davoll said to look for more automation and smart analytics capabilities. While not announced yet, the 2018.4 release will likely become available to beta users in the next couple weeks, he added.
On the data preparation side, vendors that Alteryx competes with include Datawatch, Paxata and Trifacta. In addition, self-service BI vendor Tableau, whose software is often complemented by Alteryx's technology in user deployments, released its own Tableau Prep tool last spring, enabling users to do at least some basic data preparation tasks directly in their Tableau systems.
According to Farmer, Alteryx 2018.3 could be seen partly as a response to Tableau Prep that's designed to raise Alteryx's analytics and data visualization profile with users. Although, he said the Tableau tool "has been less impactful on Alteryx than many expected."