'Building the Data Lakehouse' explores next-gen architecture
This book excerpt by 'father of the data warehouse' Bill Inmon and experts Mary Levins and Ranjeet Srivastava explores the latest methods for wrangling data into usable intel.

In Building the Data Lakehouse (September 2021, Technics Publications), authors Bill Inmon, Mary Levins and Ranjeet Srivastava explain the data lakehouse, which they describe as the next generation version of the data warehouse and data lake. In this chapter excerpt, they delve into the elements that compose the data lakehouse and explain its infrastructure.
The data lakehouse is an amalgamation of different types of data. Each of the different types of data has their own physical characteristics.
The data lakehouse consists of:
- A data lake, where raw amounts of text are placed;
- An analytical infrastructure, where descriptive information is made available to the end user; and
- A collection of different kinds of data -- structured, textual, and other unstructured data.
The data found in the data lakehouse is open.
Let's dive deeper into each of these components.
Types of data
The three different types of data found in the data lakehouse include the following:
- Structured data: transaction-based data;
- Textual data: data from conversations and written text; and
- Other unstructured data: analog data and IoT data; typically machine-generated data.
Structured data
The earliest type of data to appear in computers was structured data. For the most part, structured data comes from the execution of transactions. A transaction executes, and one or more structured records are written from the data that flows from the transaction.
The structured environment contains records. There is a uniform structure of the record for each occurrence. The records contain different kinds of information -- keys, attributes, and other kinds of information. In addition, some indexes help with finding the location of a given structured record.
The records are created in the structured environment via a database, where they can be accessed individually or collectively. Of course, records can be deleted or modified once entered into the database.
 Learn more about this
book from Technics
Publications
Textual data
The second type of data found in the data lakehouse is textual data. Textual data can come from anywhere -- telephone conversations, email, the internet, and so forth. As a rule, it does not do any good to store raw text in the data lakehouse. Instead, it is normal to store text in a database format. By storing text in a database format, analytical tools can be used against the text. A data lakehouse is capable of storing raw text, if that is what the business needs.
There are -- at a minimum -- certain types of textual data that are necessary to store in the data lakehouse:
- The source of the data
- The word of interest
- The context of the word
- The byte address of the word within the document
Other unstructured data
The third type of data found in the data lakehouse is the other unstructured category of data. This typically means analog data and IoT data, which are generated and collected by machines. There can be any number of types of measurements:
- Time of day
- Temperature
- Speed of processing
- Machine doing the processing
- Sequence number of processing
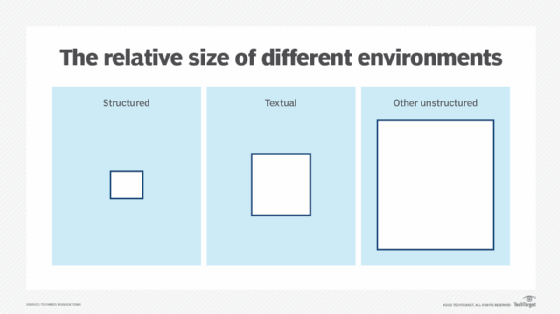
Different volumes of data
When comparing the sheer volume of data in the different environments of the data lakehouse, there is a stark difference. The volume of data found in the structured environment is typically the smallest amount of data. The volume of data found in the textual environment is greater than in the structured environment (but still less than the volume found in the other unstructured environment, the analog/IoT environment.) And the volume of data found in the other unstructured environment is the greatest of all.
Relating data across the diverse types of data
One of the more important features of the different physical environments found in the data lakehouse environment is relating the data from one environment to the next. When doing analytics on the data lakehouse, relating data from different environments is often a very useful thing to do.
It is necessary to have a common key in the environments to do analytics. There are different kinds of common keys that can be used, depending on the environment. However, some data defies the existence of a common key. In some cases, there simply is no common key.
Segmenting data based on probability of access
The analog and the IoT environment often place all of their data on bulk media. It is less expensive to do so, and it is expedient at the moment of storage of the data. But the problem with data placement in bulk storage is that bulk storage is not optimal for analysis. So, an alternate strategy is to place some of the analog and IoT data in bulk storage and the remainder in standard disk storage. The data placed in bulk storage has a low probability of access, and the data placed in disk storage has a high probability of access.
This arrangement of data accommodates the need for storage of large amounts of data balanced against the need for analytical processing of some of the data.
Relating data in the IoT and the analog environment
The data found in the analog and the IoT environment may or may not be related.
There is then a diversity of data types found in the data lakehouse. Each type of data has its own set of considerations regarding volume, structure, relatability and other characteristics. When there is no common key across the different types of data, it is possible to use a universal connector.
There are a host of universal common connectors, such as:
- Geography/location
- Time
- Dollar amounts
- Name
As a simple example of the usage of a universal common connector, consider geography. Suppose that there is a large collection of X-rays. The X-rays are a study of bone density. The bone X-rays come from a variety of states. The end user chooses two states -- California and Maryland -- for analysis. All the X-rays from California are gathered. Another collection is made of X-rays from Maryland. Finally, the end user makes an independent analysis of the X-rays from these two states.
Now, in the structured environment, the many purchases of medications that relate to bone density loss are selected. First, those medications from Maryland and California are selected. The end user determines the differences in the sale of different medications in each state. Then the X-rays are studied to determine what is the difference between bone densities in California and Maryland. The bone density analysis is now done against the states using the bone differential analysis in each state as measured against the consumption of medications in each state.
Note that there is no key structure that ties the bone X-rays to the purchase of medications. The only thing that ties the data together is the geography selected for the analysis and that bone density information is gathered.
The same sort of analysis can be done using dollar amounts, time and so forth. There are, however, other universal common connectors. There are these for humans:
- Sex
- Age
- Race
- Weight
- Other body measurements
These universal connectors can be used for relating data across the different types of data.
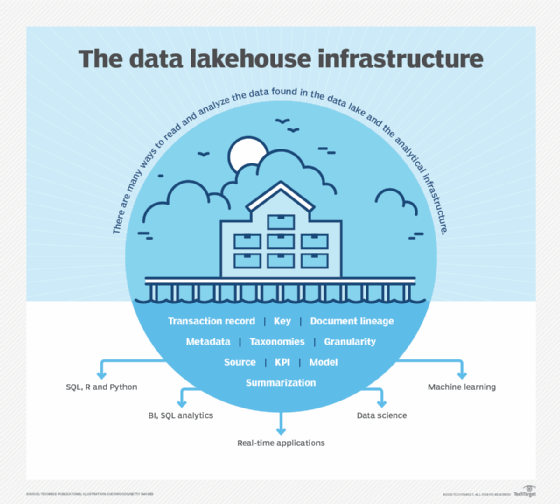
The analytical infrastructure
Of course, the analytical infrastructure derives from the raw data found in the data lake. In many ways, the analytical infrastructure is like the card catalog in a large library. Consider what happens when you enter a large library. How do you find a book? Do you start to walk from stack to stack, sequentially searching for your book? If you take this approach, plan to be in the library for a long time. Instead, you quickly and efficiently search the card catalog. Once you have located your book in the card catalog, you know exactly where to go in the library to find your book. The analytical infrastructure plays the same role as the card catalog.
Once the data is found, it is then open for analysis and access. There are many ways to read and analyze the data found in the data lake and the analytical infrastructure:
- SQL, R, and Python
- BI tools, such as Tableau, Qlik, Excel, PowerBI
- real-time applications
- data science and statistical analysis
- machine learning