
Getty Images
Learn to manage Kubernetes costs with this Kubecost tutorial
Managing Kubernetes environments can be complex -- and expensive. Find out how to get started with Kubecost, a tool to monitor costs and capacity in Kubernetes clusters.

Organizations of all sizes, from small startups to enterprises, use Kubernetes to manage and orchestrate their containerized applications. As Kubernetes adoption continues to grow, so does the demand for tools to control, govern and monitor the costs of Kubernetes infrastructures.
Kubernetes admins and developer teams need automated tools that provide cost visibility and insight into Kubernetes clusters -- with straightforward setup and minimal overhead. The open source tool Kubecost, launched in 2019, aims to meet this need for cost and capacity monitoring. In this tutorial, learn how to get Kubecost up and running.
Understanding the Kubecost architecture
The following are the main components of the Kubecost architecture:
- Kubecost cost-analyzer pod. This component runs an Nginx web server that communicates with the Kubecost back end and Prometheus server. This enables users to receive metrics from Kubernetes clusters through APIs, perform calculations and analysis based on the cost model, and read or write cost utilization metrics to Prometheus for storage.
- Prometheus server. This is the time-series data store for cost metrics and analysis.
- Kube-state-metrics. This service listens to the Kubernetes API servers and generates metrics about the state of the objects, such as node and pod capacity, and status and resource requests. These metrics are exposed on the /metrics HTTP endpoint and are consumed by Prometheus.
IT teams can also enable some optional components depending on their use cases:
- Prometheus node exporter. This exposes node-level hardware and OS-level utilization metrics.
- Grafana. An open source visualization software connects to Prometheus as a data source to build dashboards using the Kubecost cost model.
- Network costs. This is a Kubernetes DaemonSet that collects network-related metrics and can be enabled during installation.
Set up and install Kubecost
Before installing Kubecost, fulfill the following prerequisites:
- Set up a Kubernetes cluster where Kubecost and related components deploy as pods. This can be a local cluster built using a tool like minikube or a cloud-based cluster set up through a provider, such as Azure Kubernetes Service, Amazon Elastic Kubernetes Service or Google Kubernetes Engine.
- Install and configure kubectl, a command-line tool to communicate with Kubernetes cluster control planes.
- Install and configure the latest version of Helm, the Kubernetes package manager.
Next, run the following shell commands to install Kubecost using Helm charts.
helm repo add kubecost https://kubecost.github.io/cost-analyzer/

helm upgrade --install kubecost kubecost/cost-analyzer --namespace kube-cost --create-namespace
Integrate Kubecost with kubectl
The kubectl plugin kubectl-cost provides command-line access to Kubernetes cost allocation metrics. To use kubectl-cost, install the kubectl plugin manager Krew, then run the following command to install kubectl-cost.
kubectl krew install cost
After installing the kubectl-cost plugin, run the following commands to get projected monthly costs for resources and chosen time interval.
kubectl cost namespace --show-all-resources

kubectl cost deployment --window 30d --show-cpu
Navigating the Kubecost dashboard
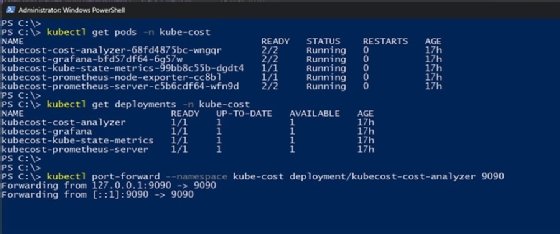
After installing Kubecost in the Kubernetes cluster, run the following commands to see the components installed in the kube-cost namespace by checking the pods and deployments in that namespace.
kubectl get pods -n kube-cost

kubectl get deployments -n kube-cost

kubectl port-forward --namespace kube-cost deployment/kubecost-cost-analyzer 9090
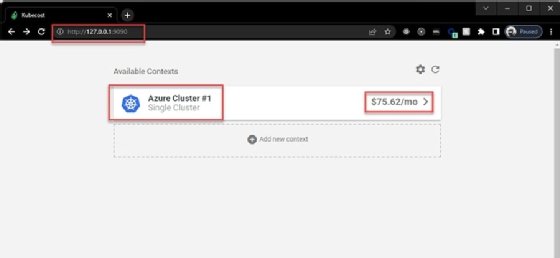
Next, open a web browser and navigate to http://127.0.0.1:9090/. On that page, choose a context for the Kubecost dashboard based on the available Kubernetes clusters.
In Figure 2, the Azure context is selected, as this example uses an Azure Kubernetes cluster. Kubecost also displays the projected monthly cost of the cluster.
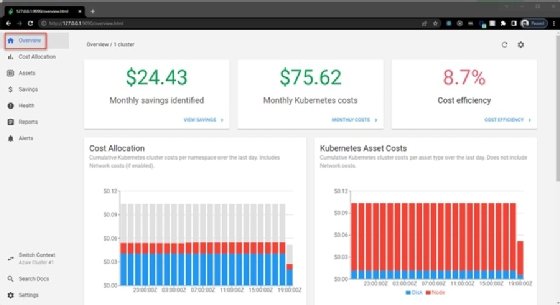
Cost overview
After choosing a cluster, the page redirects to the Overview page. This page shows high-level insights into the cluster's costs, cost efficiency and savings, highlighting any key cost drivers and outliers.
Cost allocation
The Cost Allocation page shows cumulative cost by date range and aggregation. By default, it displays cost per namespace, but users can choose a date range and one or more aggregation labels -- such as service, pod, job and controller -- from a drop-down list.

Assets
The Assets view shows Kubernetes cluster costs by cluster assets, such as node and disk.

Savings
The Savings view provides tips to reduce cluster costs by identifying underused nodes and pods, as well as abandoned resources. It also locates overprovisioned resources inside the cluster to assist in right-sizing cluster requests and limits.

Health
The Health page assesses cluster infrastructure for performance and reliability to create a cluster health rating ranging from 0 to 100. It also provides tips to improve reliability and reduce performance risk.

Reports
The Reports page provides quick access to saved reports with predefined views. Configure these reports in the Cost Allocation and Assets tabs, which enable users to choose desired aggregation and date range, and subsequently save reports.

Alerts
The Alerts view provides real-time notifications about Kubernetes spending. These updates can be integrated with Slack or email alerts.