A look at the leading data discovery software and vendors
Explore the data discovery software market, including the products and vendors helping enterprises glean insights using data visualization and self-service BI.
Turning data into business insight is the ultimate goal. It's not about gathering as much data as possible, it's about applying tools and making discoveries that help a business succeed. The data discovery software market includes a range of software and cloud-based services that can help organizations gain value from their constantly growing information resources.
These products fall within the broad BI category, and at their most basic, they search for patterns within data and data sets. Many of these tools use visual presentation mechanisms, such as maps and models, to highlight patterns or specific items of relevance. The tools deliver visualizations to users, including nontechnical workers, such as business analysts, via dashboards, reports, charts and tables.
The big benefit here: data discovery tools provide detailed insights gleaned from data to better inform business decisions. In many cases, the tools accomplish this with limited IT involvement because the products offer self-service features.
Using extensive research into the data discovery software market, TechTarget editors focused on the data discovery software vendors that lead in market share, plus those that offer traditional and advanced functionality. Our research included data from TechTarget surveys, as well as reports from respected research firms, including Gartner and Forrester.
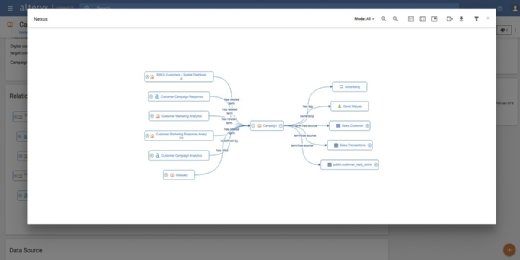
Alteryx Connect
Alteryx Inc.'s Connect markets itself as a collaborative data exploration and data cataloging platform for the enterprise that changes how information workers discover, prioritize and analyze all the relevant information within an organization.
The data discovery software market includes a range of software and cloud-based services that can help organizations gain value from their constantly growing information resources.
Combining metadata with human insight, the platform enables data analysts and line-of-business users to find, manage and collaborate on data assets, visualizations, reports and workflows otherwise siloed across departments.
Alteryx Connect key features include:
Data Asset Catalog, which collects metadata from information systems, enabling better relevant data organization;
Business Glossary, which defines standard business terms in a data dictionary and links them to assets in the catalog; and
Data Discovery, which lets users discover the information they need through search capabilities.
Other features include:
Data Enrichment and Collaboration, which allows users to annotate, discuss and rate information to offer business context and provide an organization with relevant data; and
Certification and Trust, which provides insights into information asset trustworthiness through certification, lineage and versioning.
Alteryx Connect data discovery software combines metadata with human insight.
Alteryx touts these features as decreasing the time necessary to gain insight and supporting faster, data-driven decisions by improving collaboration, enhancing analytic productivity and ensuring data governance.
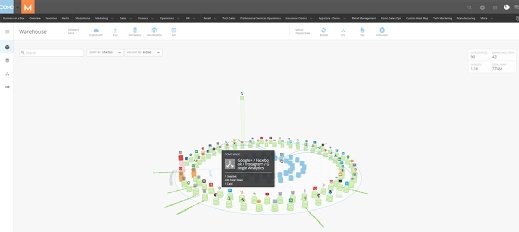
Domo
Domo Inc. provides a single-source system for end-to-end data integration and preparation, data discovery, and sharing in the cloud. It's mobile-focused, and it doesn't need you to integrate desktop software, third-party tools or on-premises servers.
With more than 500 native connectors, Domo designed the platform for quick and easy access to data from across the business, according to the company. It contains a central repository that ingests the data and aids version and access control.
Domo also provides one workspace from which people can choose and explore all the data sets available to them in the platform.
Data discovery capabilities include Data Lineage, a path-based view that clarifies data sources. This feature also enables simultaneous display of data tables alongside visualizations, aiding insight discovery, as well as card-based publishing and sharing.
Domo data discovery software is focused on the cloud and mobile access.
GoodData Enterprise Insights Platform
The GoodData Corp.'s cloud-based Enterprise Insights Platform is an end-to-end data discovery software platform that gathers data and user decisions, transforming them into actionable insights for line-of-business users.
The GoodData Enterprise Insights Platform is a cloud-based discovery software platform featuring predictive analytics.
The platform provides insights in the form of recommendations and predictive analytics with the goal of delivering the analytics that matter most for real-time decision-making. Customers, partners and employees see information that is relevant to the decision at hand, presented in what GoodData claims is a personalized, contextual, intuitive and actionable form. Users can also integrate these insights directly into applications.
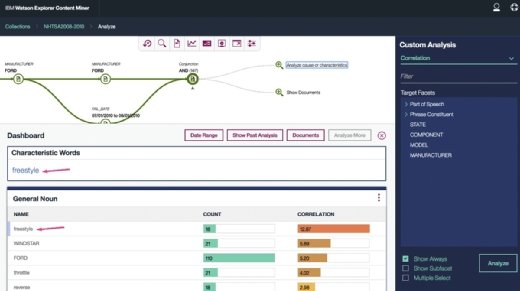
IBM Watson Explorer
IBM has a host of data discovery products, and one of the key offerings is IBM Watson Explorer. It's a cognitive exploration and content analysis platform that enables business users to easily explore and analyze structured, unstructured, internal, external and public data for trends and patterns.
Organizations have used Watson Explorer to understand 100% of incoming calls and emails, to improve the quality of information, and to enhance their ability to use that information, according to IBM.
IBM Watson Explorer is a cognitive exploration and content analysis platform.
Machine learning models, natural language processing and next-generation APIs combine to help organizations unlock value from all of their data and gain a secure, 360-degree view of their customers, in context, according to the company.
The platform also enables users to classify and score structured and unstructured data with machine learning to reach the most relevant information. And a new mining application gives users deep insights into structured and unstructured data.
Informatica
Informatica LLC offers multiple data management products powered by its Claire engine as part of its Intelligent Data Platform. The Claire engine is a metadata-driven AI technology that automatically scans enterprise data sets and exploits machine learning algorithms to infer relationships about the data structure and provide recommendations and insights. By augmenting end users' individual knowledge with AI, organizations can discover more data from more users in the enterprise, according to the company.
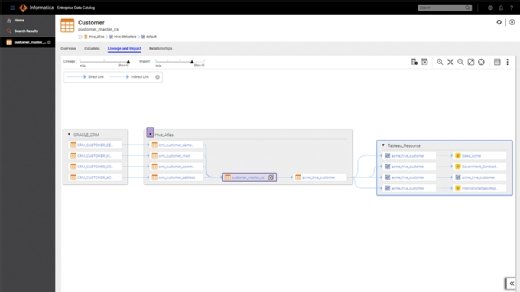
Another component, Informatica Enterprise Data Catalog, scans and catalogs data assets across the enterprise to deliver recommendations, suggestions and data management task automation. Semantic search and dynamic facet capabilities allow users to filter search results and get data lineage, profiling statistics and holistic relationship views.
Informatica data discovery software is powered by the company's Claire engine, which scans enterprise data and infers relationships to offer insights and recommendations.
Informatica Enterprise Data Lake enables data analysts to quickly find data using semantic and faceted search and to collaborate with one another in shared project workspaces. Machine learning algorithms recommend alternative data sets. Analysts can sample and prepare datasets in an Excel-like data preparation interface, which analysts can operationalize as reusable workflows.
Information Builders WebFocus
Information Builders claims its WebFocus data discovery software platform helps companies use BI and analytics strategically across and beyond the enterprise.
The platform includes a self-service visual discovery tool that enables nontechnical business users to conduct data preparation; visually analyze complex data sets; generate sophisticated data visualizations, dashboards, and reports; and share content with other users. Its extensive visualization and charting capabilities provide an approach to self-service discovery that supports any type of user, Information Builders claims.
The Information Builders WebFocus data discovery platform includes self-service BI and visual discovery tools for business decision-makers.
Information Builders offers a number of tools related to the WebFocus BI and analytics platform that provide enterprise-grade analytics and data discovery. One is WebFocus InfoApps, which can take advantage of custom information applications designed to enable nontechnical users to rapidly gather insights and explore specific business contexts. InfoApps can include parameterized dashboards, reports, charts and visualizations.
Another tool, WebFocus InfoAssist, enables governed self-service reporting, analysis and discovery capabilities to nontechnical users. The product offers a self-service BI capability for immediate data access and analysis.
Microsoft Power BI
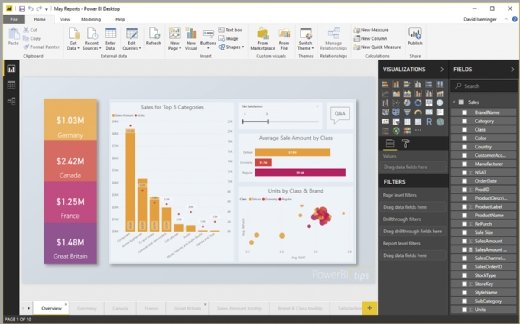
Microsoft Power BI is a cloud-based business analytics service that enables users to visualize and analyze data. The same users can distribute data insights anytime, anywhere, on any device in just a few clicks, according to the company.
As a BI and analytics SaaS tool, Power BI equips users across an organization to build reports with colleagues and share insights. It connects to a broad range of live data through dashboards, provides interactive reports and delivers visualizations that include KPIs from data on premises and in the cloud.
Microsoft Power BI connects a broad range of live data using dashboards, delivering visualizations and interactive reports.
Organizations can use machine learning to automatically scan data and gain insights, ask questions of the data using natural language queries, and take advantage of more than 140 free custom visuals created by the user community.
Power BI applications include dashboards with prebuilt content for cloud services, including Salesforce, Google Analytics and Dynamics 365. It also integrates seamlessly with Microsoft products, such as Office 365, SharePoint, Excel and Teams.
Organizations can start by downloading Power BI Desktop for free, while Power BI Pro and Premium offer several licensing options for companies that want to deploy Power BI across their organization.
MicroStrategy Desktop Client
MicroStrategy Ltd. designed its Desktop client to deliver self-service BI and help business users or departmental analysts analyze data with out-of-the-box visualizations. Data discovery capabilities are available via Mac or Windows PC web browsers and native mobile apps for iOS and Android.
All the interfaces are consistent and users can promote content between the interfaces. With the MicroStrategy Desktop client, business users can visualize data on any chart or graph, including natural language generation narratives, Google Charts, geospatial maps and data-driven documents visualizations.
The MicroStrategy Desktop client delivers self-service BI with out-of-the-box visualizations, according to the company.
They can access data from more than 100 data sources, including spreadsheets, RDBMS, cloud systems, and more; prepare, blend, and profile data with graphical interfaces; share data as a static PDF or as an interactive dashboard file; and promote offline content to a server and publish governed and certified dashboards.
OpenText EnCase Risk Manager
OpenText EnCase Risk Manager enables organizations to understand the sensitive data they have in their environment, where the data exists and its value.
The data discovery software platform helps organizations identify, categorize and remediate sensitive information across the enterprise, whether that information exists in the form of personally identifiable customer data, financial records or intellectual property. EnCase Risk Manager provides the ability to search for standard patterns, such as national identification numbers and credit card data, with the ability to discover entirely unique or proprietary information specific to a business or industry.
Risk Manager is platform-agnostic and able to identify this information throughout the enterprise wherever structured or unstructured data is stored, be that on endpoints, servers, cloud repositories, SharePoint or Exchange. Pricing starts at $60,000.
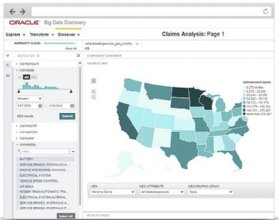
Oracle Big Data Discovery
Oracle Big Data Discovery enables users to find, explore and analyze big data. They can use the platform to discover new insights from data and share results with other tools and resources in a big data ecosystem, according to the company.
The platform uses Apache Spark, and Oracle claims it's designed to speed time to completion, make big data more accessible to business users across an organization and decrease the risks associated with big data projects.
Oracle Big Data Discovery uses Apache Spark and is designed to speed time to completion, according to the company.
Big Data Discovery provides rapid visual access to data through an interactive catalog of the data; loads local data from Excel and CSV files through self-service wizards; provides data set summaries, annotations from other users, and recommendations for related data sets; and enables search and guided navigation.
Together with statistics about each individual attribute in any data set, these capabilities expose the shape of the data, according to Oracle, enabling users to understand data quality, detect anomalies, uncover outliers and ultimately determine potential. Organizations can use the platform to visualize attributes by data type; glean which are the most relevant; sort attributes by potential, so the most meaningful information displays ; and use a scratchpad to uncover potential patterns and correlations between attributes.
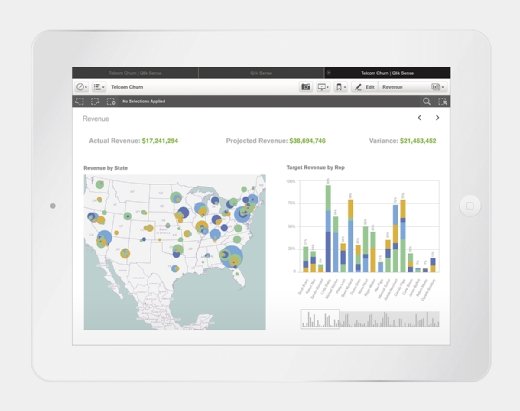
Qlik Sense
Qlik Sense is Qlik's next-generation data discovery software platform for self-service BI. It supports a full range of analytics use cases including self-service visualization and exploration, guided analytics applications and dashboards, custom and embedded analytics, mobile analytics, and reporting, all within a governed, multi-cloud architecture.
It offers analytics capabilities for all types of users, including associative exploration and search, smart visualizations, self-service creation and data preparation, geographic analysis, collaboration, storytelling, and reporting. The platform also offers fully interactive online and offline mobility and an insight advisor that generates relevant charts and insights using AI.
Qlik Sense is a self-service BI platform featuring data visualizations, dashboards, embedded analytics, mobile analytics and reporting.
For the enterprise, Qlik Sense provides a platform that includes open and standard APIs for customization and extension, data integration scripting, broad data connectivity and data-as-a-service, centralized management and governance, and a multi-cloud architecture for scalability across on-premises environments, as well as private and public cloud environments.
Qlik Sense runs on the patented Qlik Associative Engine, which allows users to explore information without query-based tools. And the new Qlik cognitive engine works with the associative engine to augment the user, offering insight suggestions and automation in context with user behavior.
Qlik Sense is available in cloud and enterprise editions.
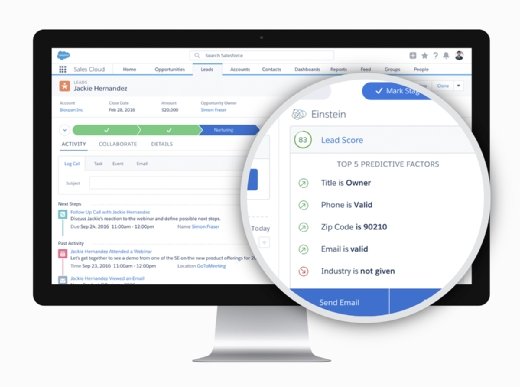
Salesforce Einstein Discovery
Salesforce's Einstein Discovery, an AI-powered feature within the Einstein Analytics portfolio, allows business users to automatically analyze millions of data points to understand their current business, explore historical trends, and automatically receive guided recommendations on what they can do to expand deals or resolve customer service cases faster.
Salesforce Einstein Discovery is an AI-powered data discovery tool within Einstein Analytics with advanced visualizations.
Einstein Discovery for Analysts lets users analyze data in Salesforce CRM, CSV files or data from external data sources. In addition, users can take advantage of smart data preparation capabilities to make data improvements, run analyses to create stories, further explore these stories in Einstein Analytics for advanced visualization capabilities, and push insights into Salesforce objects for all business users.
Einstein Discovery for Business Users provides access to insights in natural language and into Salesforce -- within Sales Cloud or Service Cloud, for example. Einstein Discovery for Analysts is available for $2,000 per user, per month. Einstein Discovery for Business Users is $75 per user, per month.
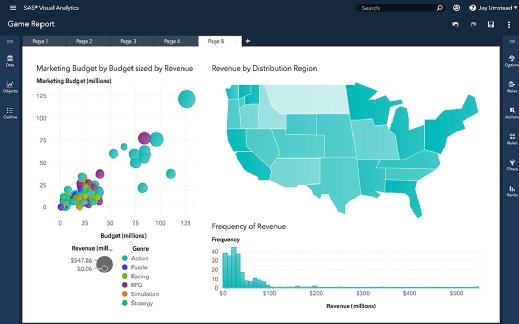
SAS Visual Analytics
SAS Institute Inc.'s Visual Analytics on SAS Viya provides interactive data visualizations to help users explore and better understand data.
The product provides a scalable, in-memory engine along with a user-friendly interface, SAS claims. The combination of interactive data exploration, dashboards, reporting and analytics is designed to help business users find valuable insights without coding. Any user can assess probable outcomes and make more informed, data-driven decisions.
SAS touts Visual Analytics as providing a user-friendly UI and scalable, in- engine.
SAS Visual Analytics capabilities include:
automated forecasting, so users can select the most appropriate forecasting method to suit the data;
scenario analysis, which identifies important variables and how changes to them can influence forecasts;
goal-seeking to determine the values of underlying factors that would be required to achieve the target forecast; and
decision trees, allowing users to create a hierarchical segmentation of the data based on a series of rules applied to each observation.
Other features include network diagrams so users can see how complex data is interconnected; path analysis, which displays the flow of data from one event to another as a series of paths; and text analysis, which applies sentiment analysis to video, social media streams or customer comments to provide quick insights into what's being discussed online.
SAP Analytics Cloud
SAP's Analytics Cloud service offers analytics capabilities for all users in one data discovery software product, including discovery, analysis, planning, predicting and collaborating, in one integrated cloud platform, according to SAP.
The service gives users business insights based on its ability to turn embedded data analytics into business applications, the company claims.
The SAP Analytics Cloud data discovery platform offers analysis, discovery, prediction, , and collaboration.
Among the potential benefits:
enhanced user experience with the service's visualization and role-based personalization features;
better business results from deep collaboration and informed decisions due to SAP's ability to integrate with existing on-premises applications; and
simplified data across an organization to ensure faster, fact-based decision-making.
In addition, Analytics Cloud is free from operating system constraints, download requirements and setup tasks. It provides real-time analytics and extensibility using SAP Cloud Platform, which can reduce the total cost of ownership because all the features are offered in one SaaS product for all users.
Sisense
Sisense Ltd. is an end-to-end platform that ingests data from a variety of sources before analyzing, mashing and visualizing it. Its open API framework also enables a high degree of customization without the input of designers, data scientists or IT specialists, according to Sisense.
Sisense data discovery software is highly customizable thanks to its open API framework, according to the company.
The Sisense analytics engine runs 10 to 100 times faster than in-memory platforms, according to the company, dealing with terabytes of data and potentially eliminating onerous data preparation work. The platform provides business insights augmented by machine learning and anomaly detection. In addition, the analytics tool offers the delivery of insights beyond the dashboard, offering new forms of BI access, including chatbots and autonomous alerts.
Tableau Desktop
Tableau Software Inc.'s Desktop is a visual analytics and data discovery software platform that lets users see and understand their data with drag-and-drop simplicity, according to the company. Users can create interactive visualizations and dashboards to gain immediate insights without the need for any programming. They can then share their findings with colleagues.
Tableau Desktop is user-friendly visual analytics and data discovery software featuring drag-and-drop functionality.
Tableau Desktop can connect to an organization's data in the cloud, on premises or both using one of 75 native data connectors or Tableau's Web Data Connector. This includes connectors to cloud data sources from cloud databases such as Amazon Redshift, Google BigQuery, SQL Server, SAP and Oracle, plus applications such as Salesforce and ServiceNow.
Tableau Desktop is included with the new Creator offering, which is part of Tableau's new subscription offerings, starting at $70 per user, per month.
Tibco Spotfire
Tibco Software Inc.'s Spotfire is an enterprise analytics platform that connects to and blends data from files, relational and NoSQL databases, OLAP, Hadoop and web services, as well as to cloud applications such as Google Analytics and Salesforce.
The product can readily integrate streaming data sources from IoT, social media and messaging with at-rest data for real-time contextual analysis.
Freely distributed accelerators include product templates to help users get to production quickly.
Tibco's Insight Platform combines live streaming data with queries on large at-rest volumes. Historical patterns are interactively identified with Spotfire, running directly against Hadoop and Spark. The Insight Platform can then apply these patterns to streaming data for predictive and operational insights.