Top business process modeling techniques with examples
Business process modeling techniques and tools provide a visual representation of processes that's crucial to effectively monitoring, improving and streamlining the flow of tasks.
All businesses have a range of processes with varying degrees of complexity that typically require multiple steps and activities managed by different departments and groups. Although these processes are vital to how businesses operate and compete, they often aren't properly mapped and documented, creating ambiguity, bottlenecks and inefficiencies that can hamper an organization's agility and decision-making.
To successfully map a process, it's important to first understand the composition of a business process, the need to document all the steps in the process, and the various modeling techniques and business process modeling tools available.
What is a business process?
A business process comprises a sequence of steps that flow in a specific order to achieve a desired outcome. Business process modeling provides an approach to mapping and representing those key steps in a visual manner to highlight how they flow together. Modeling systems are a tool for designing business processes and a method to capture a real-time view of what's going on, showing how all steps, activities, tasks and processes fit together.
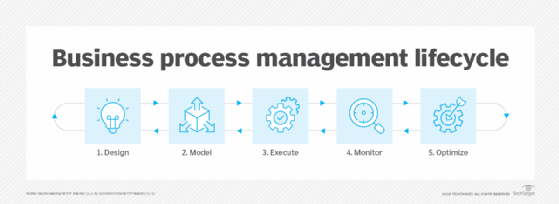
Mapping, modeling, and improving business processes are facets of business process management, a structured approach for optimizing the processes organizations use to get work done, serve their customers and generate business value. Modeling tools give managers a way to identify, characterize and illustrate the entire business process from start to finish. Effective business process management and modeling increases the awareness and understanding of the many processes in an enterprise.
Why do companies have business process modeling?
Modeling business processes is vital for two reasons. One is to identify the processes that already exist in the organization ("as is" processes) so they can be improved, automated and optimized. Another is to identify processes that need to be implemented ("should be" processes) to achieve critical business outcomes.
Business process modeling has been essential to businesses for many decades, and organizations have found success in applying modeling techniques and tools. While modeling systems are intended to be visual, they're often accompanied by varying degrees of documentation to provide greater detail when necessary.
The concept of process modeling might seem somewhat simple to grasp, but performing modeling activities can be a challenge. Often, many departments, roles and relationships are involved, making relatively simple tasks seem more complex once they're mapped.
Mapping and modeling a business process can provide many benefits:
- Assists with understanding exactly what activities need to occur and in what sequence to readily pinpoint potential delays, redundancies and opportunities for improvement.
- Enables analysis of the entire process and individual tasks so they can be continuously monitored and improved.
- Eases communication among stakeholders concerning process issues, especially for complex workflows.
- Locates bottlenecks disrupting processes as well as identifies and incorporates tasks that are being skipped or missed in the process.
- Isolates which tasks and processes can be automated to significantly increase efficiency and streamline tedious, repetitive and perhaps dangerous tasks so employees can focus on higher-value, higher-skilled work.
Business process modeling technique examples
Many process modeling techniques have been developed over the decades to support specific business needs. With so many options available, it's important to know and understand nine of the more commonly used modeling techniques, keeping in mind that not every modeling technique is right for every process.
1. Gantt charts
Named after American mechanical engineer and management consultant Henry Gantt, these charts have been actively used for more than a century to visualize process flows. Gantt charts use a bar style that illustrates a project schedule, including the duration of tasks, any dependencies, key milestones and areas of task interdependence. They're most often used in situations with specific deadlines or time-sensitive processes.
Despite their vintage, Gantt charts are still among the more popular and useful methods to show and track activities, tasks or events during certain periods of time. Processes and activities can be tracked and recorded in a sequential, easy-to-understand view clearly showing when tasks begin and end. These charts are most widely used by project managers to provide a single view, monitor tasks and keep all parties on track.
One major limitation is the simplistic approach to task visualization that can't easily accommodate subtasks -- process flows that can branch in multiple directions or tasks that repeat.
2. Flowcharts
Flowcharts visualize how a set of steps can progress in a variety of ways, using simple shapes and arrows to show each step in a process and how they interconnect. They are commonly used for graphic representations of process modeling and map the progression of actions to reach a specific outcome. They're most useful when they show straightforward business processes that generally operate in a sequential manner.
Flowcharts don't show parallel processes working in sync well, making them almost too simple for many modern business processes.
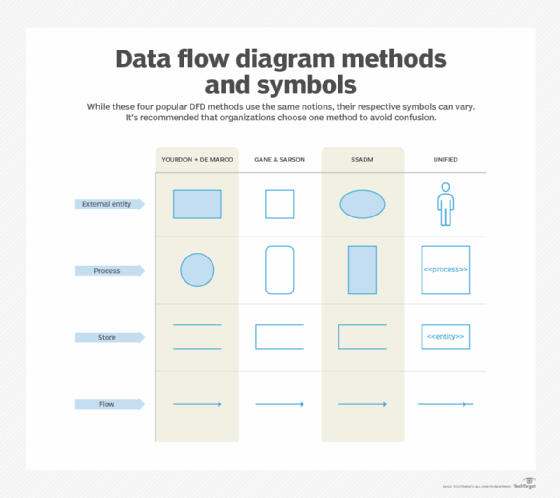
3. Data flow diagrams
Data flow diagrams (DFDs) provide a more specific visualization of data streams, detailing specific actions than can be represented in a flowchart. DFDs are best suited to display the progression of how data enters and flows through a system as well as how data is stored. They also provide visualizations and representations of flows like flowcharts but are more specifically focused on the data that flows between process steps rather than the operations of those activities.
The DFD's data-centricity presents limitations for non-data-driven projects and doesn't easily accommodate different collaborators and stakeholders in the process.
4. Business Process Modeling Notation
Business Process Modeling Notation (BPMN) encompasses a set of more than 100 standardized symbols or objects that visually represent various workflows and tasks in business processes. This technique was created specifically for modeling and is considered by many as the gold standard for business process modeling. Due to its standardized notation, BPMN provides unambiguous elements to diagram and display the flow of processes while avoiding communication gaps.
Companies might choose to enhance BPMN with their own symbols and visual language. But using standardized BPMN is recommended for outside collaboration to save time and effort when working with third parties. The following are some of BPMN's basic symbols:
- Flow objects visually show the flow of the process.
- Connecting objects display how tasks are connected and in what sequence they occur.
- Swim lanes show how responsibilities are shared and distributed among different groups, people or departments. The subtask is the "pool" and the "lanes" represent people or departments.
- Artifacts explain a process.
5. Unified Modeling Language diagrams
Unified Modeling Language (UML) diagrams were initially created by software developers to visualize systems design and interactions in a standardized way. This technique has the following distinct types:
- Structural information represents the system's structure.
- Behavioral diagrams target the relationship between objects in a system. A subset of the behavioral diagram is the interaction diagram, which visualizes the control flow.
UML diagrams are beneficial when documenting processes in software programs. But with 14 UML diagram types, this approach can be difficult to understand without a strong knowledge of UMLs.
6. Functional flow block diagrams
With origins stretching back decades, functional flow block diagrams (FFBDs) have proven valuable for business process mapping. These diagrams use a sequential order of blocks to show the tasks needed for a desired outcome. Each "parent" block can be broken into subtasks or "children" for each task in the process, so the diagrams can be easily summarized.
FFBDs are an improvement over flowcharts when representing nested functionality. But multiple blocks are required to showcase a single process, which can create a need for several diagrams.
7. Integrated definition for function modeling
Integrated definition for function modeling (IDEF) diagrams are used to model functions for business processes in which a "parent" action leads to "child" diagrams, as is the case with FFBDs. But IDEFs are far more complex. They can specify more detailed functionality, show function interdependency, and are particularly useful in mapping object-oriented and service-oriented flows.
There are 15 types of IDEFs that focus on specific flows for data, information and functions. Being inherently complex is both their greatest asset and a major limitation.
8. Petri nets and Colored Petri nets
Though somewhat esoteric, Petri nets are often used to model and analyze business process workflows. They provide a distinctive technique for mapping business processes and borrow from concepts such as Markov processes and Markov state diagrams that show transitions from one state to another. Unlike flowcharts, Petri Nets are best suited for mapping processes in which several subprocesses must be synchronized or occur simultaneously.
Petri nets can also represent a state, such as waiting or unsent, and an action, such as send, receive or transmit, in the same diagram. They can identify when processes are stalled in specific states or if there are potential undesired looping conditions. A closely related technique, Colored Petri nets use colors to discern symbols or objects, making them well-suited for a system that has numerous processes interacting and synchronizing with one another.
These techniques, however, require a big learning curve. The mathematical representation is complex and demands specific knowledge to test and deploy the diagrams.
9. Role activity diagrams
Role activity diagrams (RADs) are powerful tools used in the analysis and design of business processes. RADs focus on the activities performed by different roles within an organization. They visually map out the workflow and interactions between various roles, highlighting the sequence of actions and the flow of information. RADs facilitate a clear understanding of responsibilities and dependencies in a process, making them invaluable for optimizing operations and enhancing collaboration across teams.
10. Role interaction diagrams
Different from RADs, role interaction diagrams visually depict interactions among processes. RADs come in two versions.
- Sequence diagrams show the chronological order of interactions in a system.
- Collaboration diagrams are used to depict the interactions of specific objects in a flow.
These diagrams display the sequential and parallel aspects of a given business process. They are used to determine interfaces and class responsibilities.
Start from the beginning
While it's important to understand the various business process modeling techniques, getting started is a whole other issue. Select a process in greatest need of improvement, map all the steps in the process flow using business process management methods, and diagram and document the entire process visually using the selected modeling technique. Business process modeling can then spot potential delays, redundancies and opportunities for much-needed improvement in the process.