Brian Jackson - Fotolia
Examining the pros and cons of Microsoft Power BI tools
Power BI is a suite of business intelligence tools that targets user-friendly analysis and reporting. But what are users getting for their money, and how is it potentially useful?
Business intelligence tools can help enterprises use data to make more informed decisions. It's a popular concept today, but many BI initiatives stall amid cost and culture barriers.
Microsoft Power BI tools provide a user-friendly interface and ready-made integration with other Microsoft products. This can help organizations surmount some common business intelligence, or BI, obstacles. But, as with any change, challenges will likely remain. And, of course, Microsoft is just one in a crowded field of business intelligence tools on the market. Some offer greater or lesser capabilities, including data visualization capabilities.
Microsoft Power BI is a cloud-based data visualization service that's sold in a basic version, with some limitations, and a professional version, with greater data capacity.
Free download expansions allow Power BI tools to connect with a number of different data sources from Microsoft and other vendors. Once configured, users can manipulate that information to generate a variety of reports and data visualizations.
Deep knowledge of databases is not required, but a basic understanding of how to represent data in a meaningful way, with the right chart types and visual objects, is highly recommended.
Power BI benefits
Microsoft has offered its customers a variety of BI options over the years. As recently as last year, it offered Datazen as another on-premises BI tool. But now, Microsoft is focusing on Power BI and addressing problem spots where other BI tools faced hurdles. This appears to be working so far, and many early adopters have highlighted the following benefits:
Lower upfront costs. The basic version of Power BI is a free subscription service, where the full Power BI Pro costs $9.99 per month, per user. This enables companies to try Power BI with little financial risk. There are, however, potentially other fees related to data extraction and connectivity from system integrators or internal resources. But it appears Microsoft is making progress in mitigating cost as a barrier to launching new BI programs.
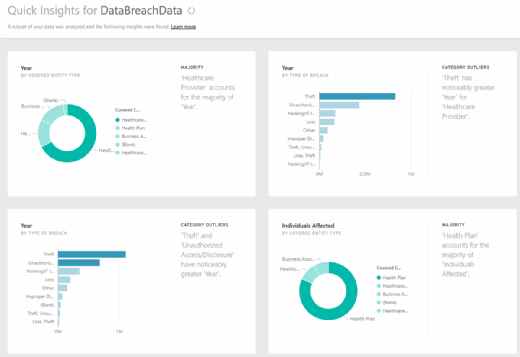
Machine learning. Microsoft added a potentially significant feature to Power BI on Dec. 1, which is called Quick Insights. The feature allows users to create subsets of data and apply analytics to that information automatically. According to Microsoft, the feature sets a growing list of analytical algorithms against the data, and can automatically provide insights about discovery and visualization correlations, outliers, trends, seasonality, change points in trends and major factors within the data.
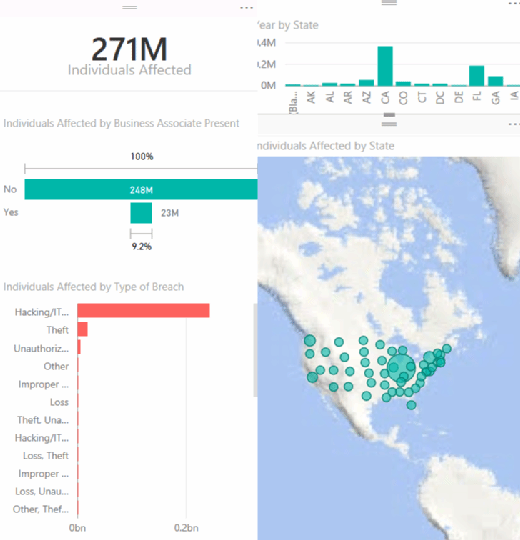
This Power BI functionality is being used to combat data breaches in the health sector, automatically generating interactive charts that can help visualize trends.

Mobility. Power BI tools are available for mobile apps in Android and iOS, allowing easy use on a variety of devices. Executives and managers can download the app for their platform, log on with their email address, and then view the dashboards and reports.
Cortana integration. Power BI was recently integrated with Cortana, Microsoft's virtual assistant. Using Cortana's natural language capabilities, a user can now access Power BI analytics and results with verbal questions. This demos well and speaks of the power of integrated platforms. Combining features within Windows 10, Cortana and Power BI, users are able to ask for reports that are dynamically generated within seconds.

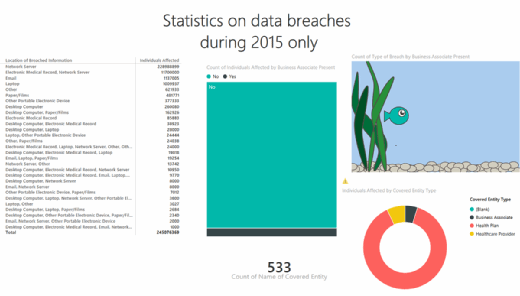
Customization. Another area worth mentioning is the visual customization capabilities for developers. Should an organization or developer wish to alter or personalize the visuals of Power BI, there's an option for custom building or to import alternatives into the platform. Based on the current samples available in the gallery, users have been able to successfully build out creative visuals. Figure 3 visualizes data with an aquarium that uses the size of the fish to reflect key data elements.

APIs for integration. Power BI offers extendibility for developers to incorporate the platform with custom software. Sample code and APIs are available online to help developers embed the Power BI dashboard with other products.
Advanced analytics. The Microsoft analytics platform is called Cortana Analytics Suite, and it provides Power BI access to analytics and data management services -- such as Azure Data Factory, Azure Data Lake, SQL Data Warehouse, Azure Machine Learning, Azure HDInsight and Stream Analytics. The point is that a wide variety of capabilities can be used alongside Power BI, further extending its potential usefulness.
User-friendly. From a business standpoint, other significant appeals of Power BI are its ease of use and customization. Power BI empowers business users to stop relying on consultants and report writers, and puts them in the driver's seat once the data has been delivered.
Users with different levels of computer expertise reported the tool is much easier to navigate and work with than other BI tools. Longtime Excel users said Power BI unleashes a new set of capabilities that can take traditional charts and reports to a whole other level.
Challenges of Power BI
Microsoft Power BI also presents some potential challenges.
Power BI once had the ability to integrate with SharePoint, but not anymore. With no native integration or delivery of the dashboard to the SharePoint portal, users must rely on the Power BI app, portal or mobile app to consume information. As a result, users must leave the Intranet site to interact with the data, unless they find a workaround.
Another issue is getting Microsoft analysis services to interact with non-Microsoft data sources. Until November 2015, several data sources were not available for users. Clients using platforms such as SAP Hana recently welcomed a preview connector, but its preview status indicates the potential for bugs.
A smaller number of users have reported that the Power BI designer tool is somewhat limited in terms of branding and themes. Many Power BI community boards contain requests for background-image support or theming of charts -- similar to what Microsoft Excel offers.
Finally, some users had issues with the volume of enhancements and the feature release rate. The most common feedback is, "I didn't even realize it can do that now." Microsoft has done a great job at adding more features, and has been diligent about posting word about it on the Internet. But this requires companies to either constantly monitor those sites, or stay engaged with a consultant. Microsoft has recognized this gap, and has been incentivizing partners to work with accounts in order to ensure they are maximizing use of the tools.
Conclusion
Analytics and BI have consistently been a top priority for IT executives the last few years, but adoption hurdles remain common and hamper these efforts for some organizations.
In looking to address that, Microsoft has been able to leverage their existing client relationships to help launch Power BI and other analytics services. As a result, many companies are taking the steps to evaluate how it could work for them.
This is probably the right approach for Microsoft: to focus on getting Power BI tools into the hands of business users and increasing adoption. Once those users begin to see the value, the demand for deeper analytics and cloud services will likely increase as a result.


