
What is data storytelling?
Data storytelling is the process of translating complex data analyses into understandable terms to inform a business decision or action. Data analysis focuses on creating valuable insights from data to give context and understanding to an intended audience. The goal of data storytelling is to present data analysis conclusions in easy-to-understand terms and to facilitate decision-making.
With the rise of digital business and data-driven decision management, data storytelling has become a skill associated with data science and business analytics. Storytellers use sophisticated data analyses to reveal relationships and provide insights for decision-makers who don't have the skills to interpret the data themselves.
Effective data storytelling goes beyond data analytics, blending stories and infographics into data insights that can then be used to deliver actionable insights and improve processes.
How data storytelling works
Data storytelling is a way to convey and interpret complicated metrics for business executives and customers. A good data story uses interactive data visualizations to present a compelling narrative that makes the entire process and message easy to understand.
For example, marketing executives using Google Analytics website performance data to analyze a website marketing campaign might find the data on its own difficult to understand. However, when this data is transformed into bar charts and other graphics, it visually communicates pertinent information and insight into the campaign's performance. Data storytelling goes a step further, wrapping the data and charts in a narrative that interprets how website performance affected the marketing campaign.
Tom Davenport, professor of information technology and management at Babson College in Wellesley, Mass., said in a 2015 Deloitte Insights article that it's the narrative that's important, no matter the medium. "Narrative is the way we simplify and make sense of a complex world," he said. "It supplies context, insight, interpretation -- all the things that make data meaningful and analytics more relevant and interesting."
Another expert, Howard Dresner, founder and chief research officer of Dresner Advisory Services, described data storytelling as a set of features within visualization tools that enable a more interactive experience with the data.
Data storytelling offers a narrative with a beginning, middle and end. This lets people who aren't data analysts understand the importance and significance of the data. The narrative is told as an example or experience. It should be unbiased and provided in the proper context. For example, in conveying a problem with a product, the storyteller uses collected data to describe how product users encounter this issue and how it affects them.
Importance of data storytelling
Telling stories frames information in a way that's clear and memorable. A story can engage people and present the data in a way they can process, comprehend and empathize with any effects the data shows.
Data storytelling is a great way to gather insights about data for the following people:
- People who lack formal training in how to read data gathered from the dashboards of data analysis tools.
- People who are easily overwhelmed by a massive amount of data points and have trouble finding meaning or remembering data presented to them in a typical dashboard, chart or graph.
The 3 components of data storytelling
Data storytelling is made up of three key parts:
- Data. The data set is the base of a data story. The storyteller gathers accurate data and analysis from other research, surveys, charts, graphs and dashboards using tools for analyzing data.
- Narrative. This is a verbal or written storyline that uses data to communicate insights effectively. The narrative should be within the context of the data and present a clear explanation of what the data means and its importance.
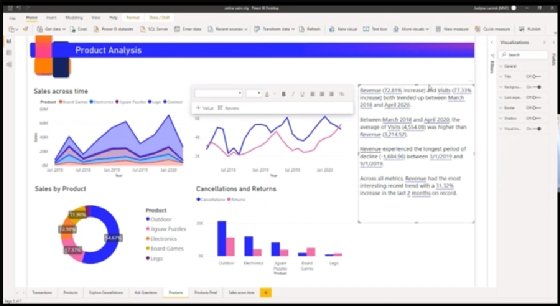
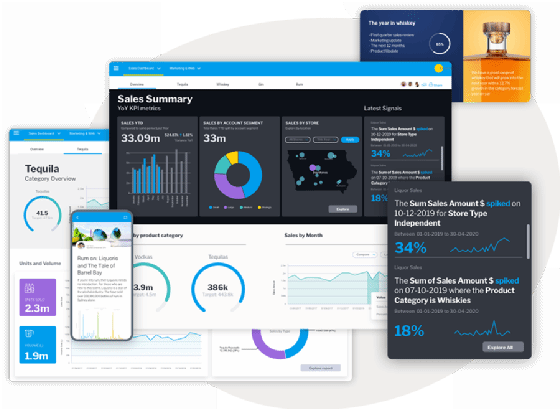
- Visualizations. These provide representations of the data and the narrative and are used to communicate the story more clearly. Visualizations include graphs, charts, diagrams, videos and photos.
What makes a good data story?
Besides data, narrative and visualizations, a good data story must also include the following elements:
- Setting. The setting should be based on the data. If the data is about internal systems, then the setting is inside an organization with the same internal setup.
- Characters. The characters could include customers, the organization, stakeholders and other key players the data surrounds.
- Conflict. The conflict is any issue and the effects of that issue that the data might present. The conflict affects the characters or setting.
- Resolution. The resolution is a proposed solution to any apparent issues or anything that might help inform the decision-making processes.
Data stories don't always need conflicts. However, if this element of the data story is skipped, the resolution is a recommended course of action.
Each insight that the data shows can also be illustrated with a visualization to help the audience better follow along. Communicating an effective data story requires hard skills and soft skills.
Data stories vs. data visualizations
Data storytelling and visualization are ideally part of an overall presentation. The former uses words to convey the message, while the latter uses visuals, such as graphics, videos and photographs, to deliver the message.
One important source of visuals is a system dashboard, especially one that has a good blend of images along with letters and numbers. These dashboards map and present data so it's easier to understand. Storytelling can then be used to communicate the meaning of the data with a call to action by the audience.
How to tell an effective data story
When preparing to deliver a data story, there is a general series of steps to follow.
1. Know your audience
The most important step in the storytelling process is to identify and understand a prospective audience. Who is attending? What are their overall roles? What are their roles in the situation being discussed? What are their expectations?
An audience of C-level people has a different perspective and expectations than a group of IT professionals. Naturally, it's preferable to have a largely homogeneous audience. With an audience of different types of people, the challenges increase considerably. The storyteller must be well prepared and adaptable to the audience.
Part of knowing one's audience is discerning their expectations -- that is, knowing what they hope to learn from the story and the data behind it.
2. Build a structured story based on facts
The story needs to have a beginning, middle and end. Technical and nontechnical elements must be woven into the storyline in ways that are clear to the audience. Discussing data-based facts isn't exciting, but a memorable story is. Take the basic information, and weave it into a story that is understandable, is believable and delivers the right message.
3. Use language your audience understands
If the audience is technical, it's OK to use technical terms and jargon. By contrast, an audience of senior managers might respond better to nontechnical terms aligned with their interest and expertise. For this audience, use business-related terms, and avoid tech jargon.
4. Base your story in the real world
Create a story that's real and, when possible, is based on real-world events. If the story is hypothetical, be sure the audience understands that. This is where a visual storytelling tool, such as Shorthand, can be helpful.
5. Gauge audience response and sum up
Whether you're standing at a podium or walking around a conference room, make eye contact with the audience, watch body language, and listen to their comments and questions. Finally, summarize the story, and answer any follow-on inquiries.
Benefits of data storytelling
When data storytelling is performed at its best, the audience hears a compelling story based on complex information. It's then able to make better decisions to address the story's issue.
It isn't enough to simply entertain, though that can be important; the end game of the story must be achieved. When the audience has that aha moment where they get the point of the story, it's an indication they understand the message.
Storytelling builds on the facts of a situation and blends in real-world experience to take the data to a higher and more understandable level.
Examples of good data stories
Data storytellers have become increasingly popular. For example, the Spotify music app sends out recap stories annually to its users. On Dec. 1 of each year, users get a wrap-up of their music and podcast consumption with statistics based on all the music they listened to that year. Seeing this data offers an engaging way for users to understand their music listening patterns.
Similarly, Slack sends an email to its customers that consists of a visual story that expresses key insights on how they've used the service.
Automated Insights' natural language generation software turns data into human-sounding narratives. For example, statistics from a basketball game can become a news story. A company's sales and marketing data can be used to generate a press release.
The future of data storytelling
Data storytelling capabilities are likely to dramatically improve in the coming years with advances in artificial intelligence (AI), machine learning and data visualization technologies. Data scientists expect storytelling tools will become more sophisticated and user-friendly. The storytelling process is already becoming simpler as the use of AI-based tools, such as ChatGPT, increases.
With the proper instructions and training, AI components can sift through tons of data and synthesize it into an understandable format. These powerful tools can then highlight the most important aspects that can be used in the data story.
Learn more about the future growth of data storytelling in business intelligence.