Monitoring vSphere performance with command-line tools
Use this chapter excerpt to learn about VMware's command-line utilities that can help solutions providers with monitoring customers' performance and resource usage.
Solutions provider takeaway: This chapter excerpt helps solutions providers to use VMware's command-line utilities for monitoring customers' performance and resource usage.
Workingwith Command-Line Tools
|
||||
In addition to alarms and performance graphs, VMware also provides a couple command-line utilities to help with monitoring performance and resource usage. Unless stated otherwise, thesetools work only with VMware ESX and not VMware ESXi, because they rely upon the presence of the Linux-based Service Console present only with VMware ESX.
Using esxtop
You can also monitor virtual machine performance using a command-line tool named esxtop. A great reason to use esxtop is the immediate feedback it gives you after you adjust a virtual machine. Using esxtop, you can monitor all four major resource types (CPU, disk, memory, and network) on a particular ESX host. Figure 12.14 shows some sample output from esxtop.
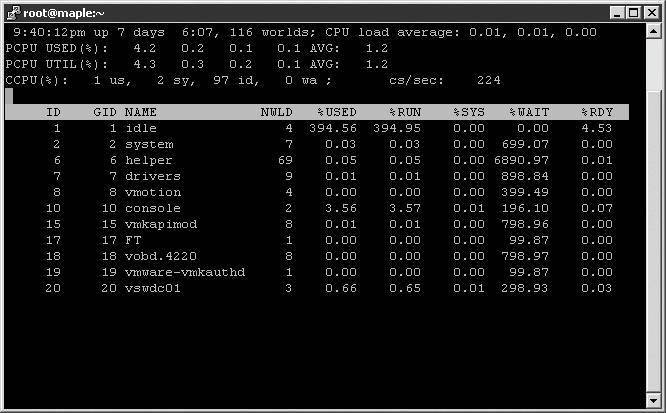
Figure 12.14
esxtop shows real-time information on CPU, disk, memory, and network utilization.
Esxtop Is Only for VMware ESX
Because esxtop runs in the Linux-based Service Console, it works only on VMware ESX and not VMware ESXi. VMware supplies a separate tool called resxtop that supports VMware ESXi. I discuss that tool later in this section.
Upon launch, esxtop defaults to showing CPU utilization, as illustrated in Figure 12.14. At the top of the screen are summary statistics; below that are statistics for specific virtual machines and VMkernel processes. To show only virtual machines, press V. Be aware that esxtop, like many Linux commands you'll find in the ESX Service Console, is case sensitive, so you'll need to be sure to use an uppercase V in order to toggle the display of VMs only.
Two CPU counters of interest to view with esxtop are the CPU Used (%USED) and Ready Time (%RDY). You can also see these counters in the virtual machine graphs, but with esxtop they are calculated as percentages. The %WAIT counter is also helpful in determining whether you have overallocated CPU resources to the VM. This might be the case if, for example, you've allocated two vCPUs to a virtual machine that really needs a single vCPU only. While in CPU mode, you can also press lowercase e to expand a virtual machine's CPU statistics so that you can see the different components that are using CPU time on behalf of a virtual machine. This is quite useful in determining what components of a virtual machine may be taking up CPU capacity.
If you switch away to another resource, press C (uppercase or lowercase) to come back to the CPU counters display. At any time when you are finished with esxtop, you can simply press q (lowercase only) to exit the utility and return to the Service Console shell prompt.
Esxtop Shows Single Hosts Only
Remember, esxtop shows only a single ESX host. In an environment where VMotion, VMware Distributed Resource Scheduler (DRS), and VMware High Availability (HA) have been deployed, virtual machines may move around often. Making reservation or share changes while the virtual machine is currently on one ESX host may not have the desired consequences if the virtual machine is moved to another server and the mix of virtual machines on that server represents different performance loads.
To monitor memory usage with esxtop, press m (lowercase only). This gives you real-time statistics about the ESX host's memory usage in the top portion and the virtual machines' memory usage in the lower section. As with CPU statistics, you can press V (uppercase only) to show only virtual machines. This helps you weed out VMkernel resources when you are trying to isolate a problem with a virtual machine. The %ACTV counter, which shows current active guest physical memory, is a useful counter, as are the %ACTVS (slow moving average for long-term estimates), %ACTVF (fast moving average for short-term estimates), %ACTVN (prediction of %ACTV at next sampling), and SWCUR (current swap usage) counters.
|
||||
To monitor network statistics about the vmnics, individual virtual machines, or VMkernel ports used for iSCSI, VMotion, and NFS, press n (lowercase only). The columns showing network usage include packets transmitted and received and megabytes transmitted and received for each vmnic or port. Also shown in the DNAME column are the vSwitches or dvSwitches and, to the left, what is plugged into them, including virtual machines, VMkernel, and Service Console ports. If a particular virtual machine is monopolizing the vSwitch, you can look at the amount of network traffic on a specific switch and the individual ports to see which virtual machine is the culprit. Unlike other esxtop views, you can't use V (uppercase only) here to show only virtual machines.
To monitor disk I/O statistics about each of the SCSI controllers, press d (lowercase only). Like some other views, you can press V (uppercase only) to show only virtual machines. The columns labeled READS/s, WRITES/s, MBREAD/s, and MBWRTN/s are most often used to determine disk loads. Those columns show loads based on reads and writes per second and megabytes read and written per second.
The esxtop command also lets you view CPU interrupts by pressing i. This command will show you the device(s) using the interrupt and is a great way to identify VMkernel devices, such as a vmnic, that might be sharing an interrupt with the Service Console. This sort of interrupt sharing can impede performance.
Another great feature of esxtop is the ability to capture performance data for a short period of time and then play back that data. Using the command vm-support, you can set an interval and duration for the capture.
Perform the following steps to capture data to be played back on esxtop:
1. Using PuTTY (Windows) or a terminal window (Mac OS X or Linux), open an SSH session to an ESX host.
2. Enter the su -- command to assume root privileges.
3. While logged in as root or after switching to the root user, change your working directory to /tmp by issuing the command cd /tmp.
4. Enter the command vm-support -S -i 10 -d 180. This creates an esxtop snapshot, capturing data every 10 seconds, for the duration of 180 seconds.
5. The resulting file is a tarball and is gzipped. It must be extracted with the command tar -xzf esx*.tgz. This creates a vm-support directory that is called in the next command.
6. Run esxtop -R /vm-support* to replay the data for analysis.
For command-line junkies, esxtop is a great tool. Unfortunately, it's limited to VMware ESX because it relies upon the Linux-based Service Console. However, VMware does have a tool for performing some of the same tasks with ESXi. It's a tool called resxtop.
Using resxtop
Because VMware ESXi lacks a user-accessible Service Console where you can execute scripts, you can't use ''traditional'' esxtop with VMware ESXi. Instead, you have to use ''remote'' esxtop, or resxtop. The resxtop command is included with the vSphere Management Assistant (vMA), a special virtual appliance available from VMware that provides a command-line interface for managing both VMware ESX and VMware ESXi hosts.
Using resxtop is much the same as using esxtop. Before you can actually view real-time performance data, though, you first have to tell resxtop which remote server you want to use. To launch resxtop and connect to a remote server, enter this command:
resxtop --server esx1.vmwarelab.net
You'll want to replace esx1.vmwarelab.net with the appropriate hostname or IP address of the ESX/ESXi host to which you want to connect. When prompted, supply a username and password, and then resxtop will launch. Once resxtop is running, you can use the same command to switch between the various views.
Now that I've shown you the various tools that you will use to monitor performance in a VMware vSphere environment, let's go through the four major resources -- CPU, RAM, network, and disk -- and see how to monitor the usage of these resources.
![]()
![]() Monitoring VMware vSphere performance
Monitoring VMware vSphere performance
![]() Monitoring vSphere performance using vCenter Server alarms
Monitoring vSphere performance using vCenter Server alarms
![]() Monitoring vSphere performance with vCenter Server performance graphs
Monitoring vSphere performance with vCenter Server performance graphs
![]() Monitoring vSphere performance with command-line tools
Monitoring vSphere performance with command-line tools
![]() Monitoring vSphere CPU and memory usage
Monitoring vSphere CPU and memory usage
Printed with permission from Wiley Publishing Inc. Copyright 2009. Mastering VMware vSphere 4 by Scott Lowe. For more information about this title and other similar books, please visit Wiley Publishing.