What is data management and why is it important? Full guide

Data management is the process of ingesting, storing, organizing and maintaining the data created and collected by an organization. Effective data management in IT systems is crucial to running business operations and delivering information that helps drive decision-making by corporate executives, business managers and other end users.
The data management process includes different functions that collectively aim to make data accurate, available and accessible. Most of the required work is done by IT professionals and data management teams. But business users typically participate in the process to ensure that data meets their needs and to help create internal data standards and usage policies as part of data governance programs.
This comprehensive guide to data management further explains what it is and provides insight on its individual disciplines, best practices, challenges that organizations face and the business benefits of a successful data management strategy. You'll also find an overview of data management tools and techniques. Throughout the guide, hyperlinks point to related articles that provide more information and offer expert advice on managing data.
Importance of data management
Data increasingly is seen as a corporate asset that can be used to make better-informed business decisions, improve marketing campaigns, optimize business operations and reduce costs, all with the goal of increasing revenue and profits. But a lack of proper data management can saddle organizations with incompatible data silos, inconsistent data sets and data quality problems. Those issues limit their ability to run business intelligence (BI) and analytics applications -- or, worse, lead to faulty findings.
Data management has also grown in importance due to an increasing number of regulatory compliance requirements, including data privacy and protection laws such as GDPR and the California Consumer Privacy Act (CCPA). In addition, companies are capturing ever-larger volumes of data and a wider variety of data types -- both hallmarks of the big data systems many have deployed. Without good data management, such environments can become unwieldy and hard to navigate.
What are the key elements of the data management process?
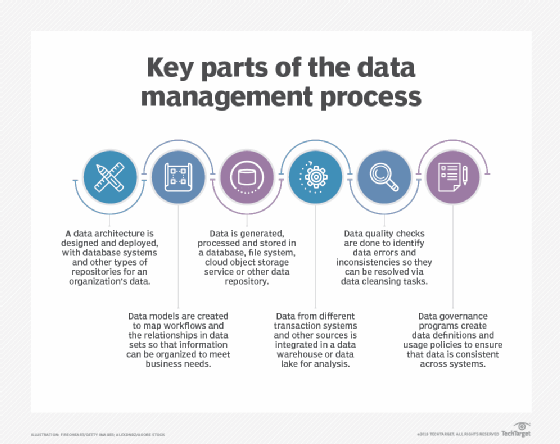
The separate disciplines that are part of data management cover a series of steps, from data processing and storage to governance of how data is formatted and used. Here's an overview of the primary functions in the process.
Data architecture. Developing a data architecture is often the first step, particularly in large organizations with lots of data to manage. A data architecture provides a blueprint for managing data by documenting data assets and mapping data flows in systems. In a broader sense, it also builds a framework for deploying databases and other data platforms, including specific technologies to fit individual applications.
Database administration. Databases are the most common platform used to hold corporate data. They contain a collection of data that's organized so it can be accessed, updated and managed. They're used in both transaction processing systems that create operational data, such as customer records and sales orders, and data warehouses, which store consolidated data sets from business systems for BI and analytics uses.
That makes database administration an essential data management function. Core administrative tasks include database design, configuration, installation and updates. Once databases have been set up, performance monitoring and tuning must be done to maintain acceptable response times on database queries that users run. Other responsibilities for database administrators (DBAs) include data security; database backup and recovery; and application of software upgrades and security patches.
Other fundamental data management disciplines, which are covered in more detail in the next section, include the following:
- Data integration, which combines data from different data sources for operational and analytical uses.
- Data modeling, which diagrams data structures and the relationships between data elements.
- Data governance, which sets policies and procedures to ensure data is consistent and used properly throughout an organization.
- Data quality management, which aims to fix data errors and inconsistencies.
- Master data management (MDM), which creates a common set of reference data on customers, products and other business entities.
Data management tools and techniques
A wide range of technologies, tools and techniques can be used in the data management process. The following options are available for different aspects of managing data.
Database management systems
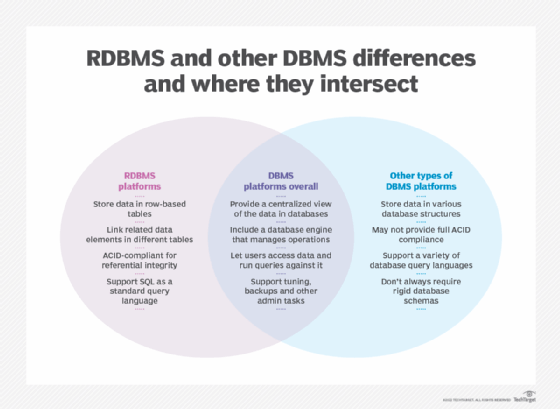
A database management system (DBMS) is the primary technology used to deploy and administer databases. It's software that acts as an interface between databases and the DBAs, end users and applications that access them. The most prevalent type of DBMS is the relational database management system (RDBMS). Relational databases organize data into tables with rows and columns that contain database records. Related records in different tables are connected through the use of primary and foreign keys, avoiding the need to create duplicate data entries.
Relational databases are built around the SQL programming language and a rigid data model best suited to structured data. They also support the ACID properties -- atomicity, consistency, isolation and durability -- for ensuring data integrity and guaranteeing that transactions are completed correctly. That has all made them the top database choice for transaction processing applications.
However, other types of DBMS technologies have emerged as viable alternatives to RDBMSes for different data workloads. Most are categorized as NoSQL databases, which don't impose rigid requirements on data models and database schemas. As a result, they can better store unstructured and semistructured data, such as sensor data, internet clickstream records and network, server and application logs.
There are four main types of NoSQL systems:
- Document databases that store data in document-like structures.
- Key-value databases that pair unique keys and associated values.
- Wide-column stores with tables that have a large number of columns.
- Graph databases that connect related data elements in a graph-like format.
NoSQL has become something of a misnomer, though. While NoSQL databases don't rely on SQL, many now support elements of it and offer some level of ACID compliance. Once meant literally, the term more commonly stands for "not only SQL" today.
Additional database and DBMS options include in-memory databases that store data in a server's memory to boost I/O performance -- with both relational and NoSQL technologies available -- and SQL-based columnar databases designed for analytics applications. Special-purpose databases can be used, too. Notable ones are time series databases that store time-stamped data sequentially; vector databases that support similarity searches in unstructured data sets; and ledger databases that create immutable transaction records. Hierarchical and network databases that run on mainframes and were first developed in the late 1960s are also still available for use.
Organizations can deploy databases in on-premises or cloud-based systems. With cloud databases, they have a choice between self-managed deployments and database as a service (DBaaS) environments that are managed for them by database vendors.
Big data management
NoSQL databases are often used in big data systems because of their ability to store and manage various data types -- structured, unstructured and semistructured. Big data environments are also commonly built around various open source technologies, including the following:
- The Spark processing engine.
- Hadoop, a distributed processing framework with a built-in file system that stores data across clusters of commodity servers.
- The HBase database and Hive data warehouse software, which both run on top of Hadoop.
- The Kafka, Flink, Storm and Samza stream processing platforms.
- Drill, Presto and Trino, three SQL query engines designed for use in big data applications.
Increasingly, big data systems are also being deployed in the cloud, using object storage technologies such as Amazon Simple Storage Service (S3), Azure Blob Storage and Google's Cloud Storage.
Data warehouses and data lakes
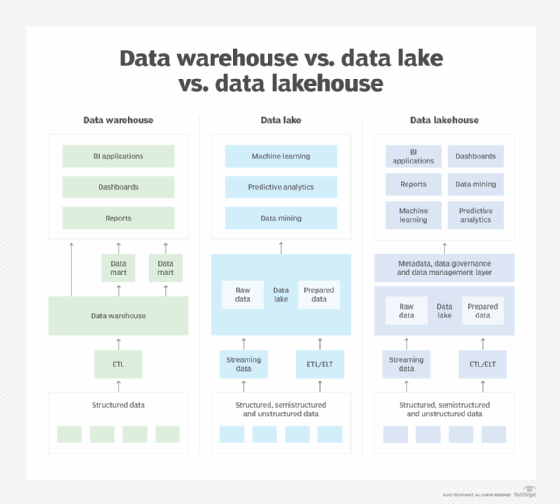
The two most widely used repositories for managing analytics data are data warehouses and data lakes. A data warehouse -- the more traditional method -- typically is based on a relational or columnar database. It stores structured data that has been pulled together from different operational systems and prepared for analysis. The primary data warehouse use cases are BI querying and enterprise reporting, which enable business analysts and executives to analyze sales, inventory management and other KPIs.
An enterprise data warehouse includes data from systems across an organization. In large companies, individual subsidiaries and business units might build their own data warehouses. Data marts are another option. They're smaller versions of data warehouses that contain subsets of an organization's data for specific departments or groups of users. In one deployment approach, an existing data warehouse is used to create different data marts; in another, the data marts are built first and then used to populate a data warehouse.
Data lakes store pools of big data for use in predictive modeling, machine learning, AI and other data science applications. At first, they were mostly built on Hadoop clusters, but S3 and other cloud object storage services are increasingly being used for data lakes. They're sometimes also deployed on NoSQL databases, and different platforms can be combined in a distributed data lake environment. The data can be processed for analysis when it's ingested, but a data lake often contains raw data stored as is. In that case, data scientists and other analysts typically do their own data preparation work for specific applications.
A third platform option for storing and processing analytical data has also emerged: the data lakehouse. As its name indicates, it combines elements of data lakes and data warehouses. Data lakehouses merge the flexible data storage, scalability and lower cost of a data lake with the querying capabilities and more rigorous data management structure of a data warehouse.
That enables them to support both BI applications and advanced analytics, essentially by adding data warehousing functionality on top of a data lake. However, data lakehouse platforms are still maturing and might not offer the full capabilities of separate data warehouses and data lakes. They also add new management complexity, including the need for strong metadata management to support the combined functionality.
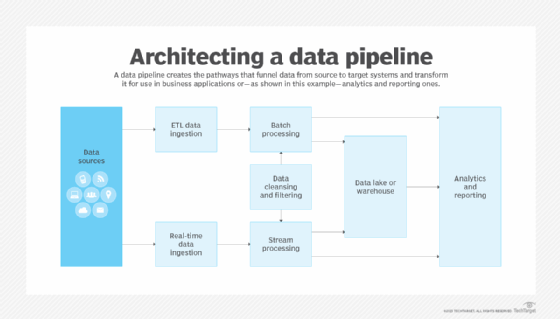
Data integration
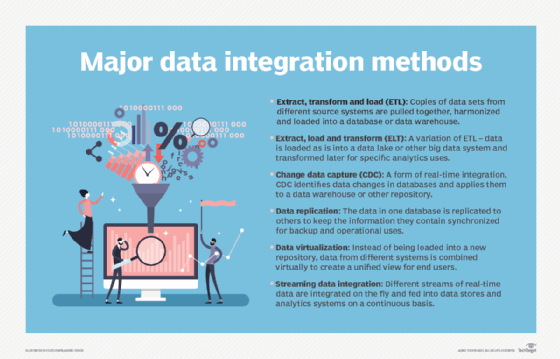
The most widely used data integration technique is extract, transform and load. ETL pulls data from source systems, converts it into a consistent format and then loads the integrated data into a data warehouse or other target system. However, data integration platforms now also support a variety of other integration methods. That includes extract, load and transform (ELT), a variation on ETL that leaves data as is when it's loaded into the target platform. ELT is a common choice for data integration in data lakes and other big data systems.
ETL and ELT are batch integration processes that run at scheduled intervals. Data management teams can also do real-time data integration, using methods such as change data capture and streaming data integration. The former applies changes in databases to a data warehouse or other repository as they're made, while the latter integrates streams of real-time data on a continuous basis. Data virtualization is another integration option; it uses an abstraction layer to create a virtual view of data from different systems instead of physically loading the data into a data warehouse.
Data modeling
Data modelers create a series of conceptual, logical and physical data models that document data sets in a visual form and map them to business requirements for transaction processing and analytics. Common techniques for modeling data include the development of entity relationship diagrams, data mappings and schemas in a variety of model types. Data models often must be updated when new data sources are added or when an organization's information requirements change.
Data governance
Data governance is primarily an organizational process; software products that help manage data governance programs are available, but they're an optional element. While the programs are often led by data management or governance professionals, they usually include a data governance committee made up of business executives. The committee, or council in some cases, collectively makes decisions on common data definitions and corporate standards for creating, formatting and using data.
Another key aspect of governance initiatives is data stewardship, which involves overseeing data sets and ensuring that end users comply with the approved data policies. Data steward can be a full- or part-time position, depending on the size of an organization and the scope of its governance program. Data stewards can also come from both business operations and the IT department; either way, a close knowledge of the data they oversee is normally a prerequisite.
Data quality
Data governance is closely associated with data quality improvement efforts. Ensuring that data quality levels are high is a key part of effective data governance, and metrics that document improvements in data quality are central to demonstrating the business value of governance programs. Key data quality techniques supported by various software tools include the following:
- Data profiling, which scans data sets to identify outlier values that might be errors.
- Data cleansing, also known as data scrubbing, which fixes data errors by modifying or deleting bad data.
- Data validation, which checks data against preset quality rules.
Master data management
MDM is also affiliated with data governance and data quality management, although it hasn't been adopted as widely as they have. That's partly due to the complexity of MDM programs, which mostly limits them to large organizations. MDM creates a central registry of master data for selected data domains -- what's often called a golden record. The master data is stored in an MDM hub, which feeds the data to analytics systems for consistent analysis and reporting enterprise-wide. The hub can also be configured to push updated master data back to source systems.
Data observability
Data observability is an emerging process that can augment data quality and data governance initiatives by providing a more complete picture of data health in an organization. Adapted from observability practices in IT systems, data observability monitors data sets and the data pipelines that deliver them to end users, identifying issues that need to be addressed. Data observability tools can be used to automate monitoring, alerting and root cause analysis procedures, as well as to plan and prioritize problem-resolution work.
Data management best practices
These are some best practices to help keep the data management process on the right track in an organization:
- Make data governance and data quality top priorities. A strong data governance program is a critical component of effective data management strategies, especially in organizations with distributed data environments that include a diverse set of systems. A strong focus on data quality is also a must. In both cases, though, IT and data management teams can't go it alone. Business executives and users must be involved to make sure their data needs are met and data quality problems aren't perpetuated. The same applies to data modeling projects.
- Be smart about deploying data management platforms. The multitude of databases and other data platforms that are available to use requires a careful approach when designing an architecture and selecting technologies. IT and data managers must be sure the data management systems they implement are fit for the intended purpose and will deliver the data processing capabilities and analytics information required by business operations.
- Be sure you can meet business and user needs, now and in the future. Data environments aren't static; new data sources are added, existing data sets change and business needs for data evolve. To keep up, data management must be able to adapt to changing requirements. For example, data teams need to work closely with end users in building and updating data pipelines to ensure that they include all of the required data for applications on an ongoing basis. This is where a DataOps process might help. A collaborative approach to developing data systems and pipelines, DataOps is derived from a combination of DevOps, Agile software development and lean manufacturing methodologies. It brings together data managers and users to automate workflows, improve communication and accelerate data delivery.
DAMA International, the Data Governance Professionals Organization and other industry groups also offer best-practices guidance and educational resources on data management disciplines. For example, DAMA has published DAMA-DMBOK: Data Management Body of Knowledge, a reference book that attempts to define a standard view of data management functions and methods. Commonly referred to as the DMBOK, it was first published in 2009. A DMBOK2 second edition was released in 2017 and revised in early 2024.
Data management risks and challenges
The following are some common challenges that data management teams often face:
- Managing large amounts of data. Ever-increasing data volumes complicate the data management process, especially when a mix of structured, semistructured and unstructured data is involved. Data integration, data quality and data governance tasks all become more complex as the amount of data that needs to be managed increases.
- Breaking down data silos. If an organization doesn't have a well-designed data architecture, it can end up with siloed systems that are difficult to integrate and manage in a coordinated way. Silos make it harder to ensure that data sets are accurate and consistent across all data platforms.
- Integrating diverse data sets and platforms. Large and siloed data sets aren't the only data integration challenges to deal with. Another one is pulling together different types of data -- for example, integrating transaction, streaming and public data sets for an analytics application. Doing so is even more complex when the data is stored in different data platforms, including both cloud and on-premises systems.
- Ensuring that end users can access data. Even in better-planned environments, enabling users to find and access relevant data can be a challenge, especially when the data is spread across various databases and big data systems. To help make data more accessible, many data management teams are creating data catalogs that document what's available in systems. The catalogs typically include business glossaries, metadata-driven data dictionaries and data lineage records.
- Moving data to the cloud. The accelerating shift to the cloud can ease some aspects of data management work, but it also creates new challenges. For example, migrating to cloud databases can be complicated for organizations that need to move data and processing workloads from existing on-premises systems. Costs are another big issue in the cloud: The use of cloud systems and managed database services must be monitored closely to make sure data processing bills don't exceed the budgeted amounts.
Data privacy laws and regulatory compliance
Many data management teams are now among the employees who are accountable for securing data and limiting potential legal liabilities for data breaches or misuse of data. As a result, data managers need to help ensure that organizations comply with government and industry regulations on data security, privacy and usage.
That became a more pressing concern with the passage of GDPR, the European Union's data privacy law that took effect in 2018, and the CCPA, which was signed into law that year and became effective in 2020. The CCPA's provisions were later expanded by the California Privacy Rights Act, a ballot measure that was approved by voters in 2020 and took effect at the start of 2023. In October 2023, California's legislature enacted another law, commonly known as the Delete Act, that includes definitions of key terms from the CCPA and creates new regulations for data brokers selling personal information to third parties.
More than a dozen other states have also now adopted comprehensive data privacy laws. That includes ones in Colorado, Connecticut, Utah and Virginia that took effect in 2023 and laws in Montana, Oregon and Texas that become effective in 2024, plus several more due to follow in 2025 and 2026. In addition, the American Privacy Rights Act, a proposed federal law that would set national data privacy rights and protections, was introduced in Congress in April 2024.
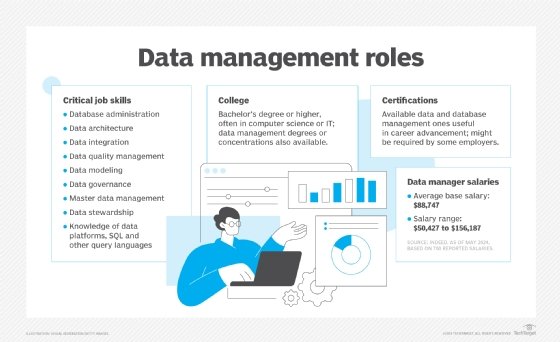
Data management tasks and roles
The data management process involves a wide range of tasks, duties and skills. In smaller organizations with limited resources, individual workers often handle multiple roles. But in larger ones, data management teams commonly include data architects, data modelers, DBAs, database developers, data quality analysts and engineers, ETL developers and data administrators. Another role being seen more often is data warehouse analyst. They help manage the data in a data warehouse and build analytical data models for business users.
Data scientists, other data analysts and data engineers -- who help build data pipelines and prepare data for analysis -- might also be part of a data management team. In other cases, they're on a separate data science or analytics team. Even then, though, they typically handle some data management tasks themselves, especially in data lakes with raw data that needs to be filtered and prepared for specific analytics uses.
Data governance managers and data stewards qualify as data management professionals, too. But they're usually part of a separate data governance team.
What are the benefits of a good data management strategy?
A well-executed data management strategy can benefit organizations in the following ways:
- Competitive edge. Data management initiatives can help companies gain potential competitive advantages over their business rivals, both by improving operational effectiveness and enabling better decision-making.
- Increased business agility. Organizations with well-managed data can become more agile, enabling them to spot market trends and take advantage of new business opportunities more quickly.
- Fewer security and privacy problems. Effective data management can also help companies avoid data breaches, data collection missteps and other data security and privacy issues that could damage their reputation, add unexpected costs and put them in legal jeopardy.
- Higher revenue and profits. Ultimately, a solid approach to data management can provide better business performance by helping to improve business strategies and processes.
Data management history, evolution and trends
The first flowering of data management was driven by IT professionals looking to solve the problem of garbage in, garbage out in the earliest computers after recognizing that the machines made errors when they were fed inaccurate or inadequate data. Mainframe-based hierarchical databases became available in the 1960s, bringing more formality to the process of managing data.
The relational database emerged in the 1970s and cemented its place at the center of the data management ecosystem during the 1980s. The idea of the data warehouse was conceived late in that decade, and early adopters began deploying data warehouses in the mid-1990s. By the early 2000s, relational software was a dominant technology, with a virtual lock on database deployments.
But Hadoop became available in 2006 and was followed by the Spark processing engine and various other big data technologies. NoSQL databases also started to become available in the same time frame. While relational platforms are still the most widely used data store by far, the rise of those alternatives and the data lake environments they enable gave organizations a broader set of data management choices. The addition of the data lakehouse concept in 2017 further expanded the options.
All these choices have made many data environments more complex. That's spurring the development of new technologies and processes designed to make them easier to manage. In addition to data observability, they include data fabric, an architectural framework that aims to better unify data assets by automating integration processes and making them reusable. There's also data mesh, a decentralized architecture that gives data ownership and management responsibilities to individual business domains, with federated governance to agree on organizational standards and policies.
None of those three approaches is widely used yet, though. In its 2023 Hype Cycle report on data management technologies, consulting firm Gartner said data fabrics and data observability tools have been adopted by less than 5% of their target user audiences. It predicted that data observability was still two to five years away from mainstream adoption, while data fabric was five to 10 years away. Data mesh has a higher adoption rate of between 5% and 20% of targeted users, but Gartner expects its core capabilities to eventually be subsumed by data fabrics -- a prediction that data mesh proponents dispute.
The following are some other notable data management trends:
- Cloud data management technologies are becoming pervasive -- and pushing innovation. Cloud database services now account for more than half of overall DBMS revenue and almost all the growth in that market, according to Gartner. In the Hype Cycle report, it said the broad migration to DBaaS deployments in the cloud is accompanied by "an extremely high pace of innovation and change" on data management technologies as a whole. That includes the development of data ecosystems, alternatively referred to as modern data stacks. They incorporate different tools into a unified data management environment to ease technology integration requirements for users, particularly in the cloud. For companies that can't or aren't ready to fully migrate, hybrid cloud architectures that combine cloud and on-premises systems -- for example, hybrid data warehouse environments -- are also an option.
- Augmented data management capabilities aim to streamline processes. Data management software vendors are adding augmented functionality to aid in data quality, database management, data integration, data cataloging and other operations. For example, AI and machine learning technologies can be used in data management to automate repetitive tasks, identify issues and suggest actions. Augmented features are also being applied in FinOps, a process for managing operational costs and decisions on technology investments in data platforms as well as other IT systems.
- Generative AI adds both new data management opportunities and needs. The emergence and rapid adoption of generative AI (GenAI) tools offers more opportunities to incorporate AI into data management processes. For example, GenAI can help data management teams write SQL queries, create data quality rules and classify, label and annotate text data. It also provides a conversational interface for using natural language to perform data management tasks. On the other hand, GenAI adds huge new data sets that further expand data management work. In addition, it's driving increased use of vector databases, which store numerical representations of unstructured data. A niche technology since the early 2000s, vector databases are a good fit for the text data used in the large language models that underpin GenAI tools, such as ChatGPT.
- The growth of edge computing is also creating new data management requirements. As organizations increasingly use remote sensors and IoT devices to collect and process data in edge computing environments, vendors are developing edge data management capabilities. Moving data management outside of cloud and on-premises data centers enables real-time analytics applications on edge data. But it requires new processes for managing and governing the data.
Craig Stedman is an industry editor who creates in-depth packages of content on analytics, data management, cybersecurity and other technology areas for TechTarget Editorial.
Jack Vaughan, a former senior news writer at TechTarget, contributed to this article.