
IT monitoring

What is IT monitoring?
IT monitoring is a process that gathers metrics on the operations of an IT environment. Organizations use IT monitoring to gather metrics from their hardware and software in order to ensure everything functions as expected, and to help detect and resolve IT-related problems.
Basic monitoring is performed through device operation checks, while more advanced monitoring provides granular views on operational statuses, such as average response times, number of application instances, error and request rates, CPU usage and software application availability. Monitoring occurs continuously or is run in periodic daily, weekly or monthly intervals.
Data gathered by IT monitoring systems provides an organization with in-depth insights into their IT environment. This helps prevent possible downtime and is increasingly helpful as IT environments grow more complex. The use of IT monitoring is also increasing, with the market size of network performance monitoring expected to grow to $3.2 billion by 2028.
How IT monitoring works
IT monitoring is implemented differently depending on the type. However, as a general process, IT monitoring covers three sections: foundation, software and interpretation.
- Foundation. The infrastructure is the lowest layer of a software stack and focuses on monitoring physical and virtual devices, such as servers, CPUs or virtual machines (VMs).
- Software. Sometimes referred to as the monitoring layer, this section analyzes the data from devices in the foundation section. Data gathered here includes CPU usage, load, memory or a running VM count.
- Interpretation. Gathered data and metrics are interpreted and presented through graphs or data charts, often on a GUI dashboard. This is often accomplished through integration with tools that specifically focus on data visualization.
IT monitoring might also rely on agents or be agentless. Agents are independent programs that install on the monitored device to collect data on hardware or software performance and report it to a management server. Agentless monitoring uses existing communication protocols to emulate an agent with many of the same functionalities.
For example, to monitor server usage, an IT admin installs an agent on the server. A management server receives that data from the agent and displays it to the user via the IT monitoring system interface, often as a graph of performance over time. If the server stops working as intended, the tool alerts the administrator, who can repair, update or replace the item until it meets a standard for operation.
Other tools used in IT monitoring may include observational tools, analysis tools and engagement tools.
- Observational tools are a basic type of tool that monitors software for operating effectiveness.
- Analysis tools take observational data and further analyze it to determine where and why IT issues occur.
- Engagement tools focus on acting upon data from observational and analysis tools in order to take actions like generating alerts or starting up another hardware or software program.
Types of IT monitoring
There are a large number of IT monitoring types that an organization could use at every level of its IT landscape.
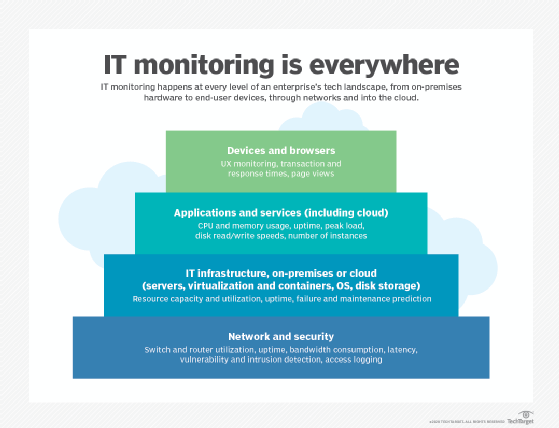
Some IT monitoring types include the following:
- IT infrastructure monitoring. IT infrastructure monitoring is a foundation-level process that collects and reviews metrics concerning the IT environment's hardware and low-level software. Infrastructure monitoring tools provide a benchmark for ideal physical systems operation, therefore easing the process to fine-tune and reduce downtime, and enabling IT teams to detect outages.
- Server and system monitoring. These monitoring tools evaluate the performance of servers and infrastructure components. Servers are monitored individually and the collective data is analyzed for network performance. Metrics gathered include server uptime and performance.
- Cloud monitoring. Cloud monitoring capabilities and options have expanded as well. Cloud customers can get visibility into certain metrics, such as CPU, memory and storage usage, to gauge how well their applications perform, but the nature of cloud infrastructure limits the view into the physical assets on which cloud workloads run.
- Network monitoring. Network monitoring seeks out issues caused by slow or failing network components or security breaches. Metrics include response time, uptime, status request failures and HTTP/HTTPS/SMTP checks.
- Security monitoring. This type of monitoring focuses on the detection and prevention of intrusions, typically at the network level. This includes monitoring networks, systems and endpoints for vulnerabilities, logging network access and identifying traffic patterns to look for potential breaches.
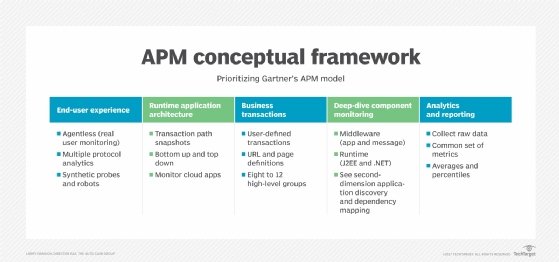
- Application performance monitoring (APM). APM gathers software performance metrics based on both end user experience and computational resource consumption. Examples of APM-provided metrics include average response time under peak load, performance bottleneck data and load and response times. Application monitoring is within the scope of application performance management, a concept that involves more broadly controlling an application's performance levels.
- Business activity monitoring. Business activity monitoring focuses on measuring and keeping track of business metrics. This type of monitoring helps assess performance metrics over larger periods of time. These tools monitor metrics such as app downloads, web sales and other metrics such as web traffic volume.
Real-time vs. trends monitoring
Real-time monitoring is a technique where IT teams use systems to continuously collect and access data to determine the active and ongoing status of an IT environment. Measurements from real-time monitoring software depict data from the current IT environment, as well as the recent past, which enables IT managers to react quickly to current events in the IT ecosystem.
Two extensions of real-time monitoring are reactive monitoring and proactive monitoring. The key difference is that reactive monitoring is triggered by an event or problem, while proactive monitoring seeks to uncover abnormalities without relying on a trigger event. The proactive approach can enable IT staff to take action to address an issue, such as a memory leak that could crash an application or server, before it becomes a problem.
Historical monitoring of data enables the IT manager to improve the environment or identify potential complications before they occur, because they identify a pattern or trend in data from a period of operation. Trend analysis takes a long-term view of an IT ecosystem to determine system uptimes, service-level agreement adherence and capacity planning.
Point-in-time vs. time-series monitoring. Point-in-time analysis examines one specific event at a particular instant. It can be used to identify a problem that must be fixed immediately, such as a 100% full disk drive. Time-series analysis plots metrics over time to account for seasonal or cyclical events and more accurately recognize abnormal behavior. Point-in-time analysis relies on fixed thresholds, while time-series analysis employs variable thresholds to paint a broader picture and better detect and even predict anomalies.
What to look for in IT monitoring software
IT monitoring software should fit into observational, analysis or engagement roles. Observational tools should enable the performance monitoring of hardware, software and services. Analysis tools take data from observational tools to create insights. And engagement tools are used to take actions such as run backups or reboot hardware.
IT monitoring tools should also provide users with alerts, product integrations, real-time analysis and deeper visualization of IT infrastructure.
IT monitoring tool options
While some IT monitoring tools are created to monitor a specific area of IT or device, like to watch over the network or CPU performance, some vendor-provided tools offer moderate overlap -- such as an APM vendor also offering IT infrastructure monitoring capabilities.
The following lists show some examples of various monitoring tool types. These lists are not comprehensive, however, and many tools incorporate capabilities typically seen in other segments.
APM tools
- AppDynamics.
- BMC TrueSight.
- Cisco AppDynamics.
- Datadog.
- Dynatrace.
- ManageEngine Applications Manager.
- Microsoft Azure Application Insights.
- New Relic.
- SolarWinds Server & Application Monitor.
IT infrastructure tools
- ManageEngine OpManager.
- Microsoft System Center Operations Manager.
- Nagios XI.
- Sematext Monitoring.
- SolarWinds Server & Application Monitor.
- Zabbix.
Cloud monitoring tools
- Amazon CloudWatch.
- Microsoft Azure Monitor.
- Cisco CloudCenter.
- Oracle Application Performance Monitoring Cloud Service.
- Veeam.
Containers/microservices/distributed app monitoring tools
- Confluent Kafka.
- Grafana.
- Lightstep.
- Prometheus.
- Red Hat OpenShift Container Platform.
AIOps tools
- BigPanda.
- Datadog.
- New Relic.
- PagerDuty.
- Splunk IT Service Intelligence.
Log monitoring tools
- Elastic Stack.
- Fluentd.
- Logstash.
- Splunk.
- Sumo Logic.
Network security monitoring tools
- Cisco DNA Analytics and Assurance.
- LiveAction LiveNX.
- LogRhythm.
- PRTG Network Monitor.
- SolarWinds Network Performance Monitor.