
17 sustainability KPIs businesses track and what they measure
Key performance indicators are … well, key to making sure a company is hitting its objectives. And, in the area of ESG, there's an array of KPIs worth knowing.

Sustainability is intricately connected to long-term business success.
Sustainability key performance indicators (KPIs) are metrics that provide tangible evidence of whether and to what degree an organization is succeeding at targeted objectives. These KPIs help organizations benchmark their environmental, social and governance (ESG) progress, ensure compliance with regulations and set investor expectations.
Here's a look at some particularly important KPIs that measure the success of ESG and sustainability initiatives.
Environmental KPIs
As companies work toward reducing their negative environmental impacts, specific sustainability KPIs help leaders assess whether they're reaching their objectives around carbon emissions, water usage and other metrics in the "E" of ESG.
Greenhouse gas (GHG) emissions
Reducing emissions from various types of greenhouse gases is a critical aspect of combatting global warming.
The categories that companies use to classify their GHG emissions are Scope 1, Scope 2 and Scope 3 emissions. Scope 1 emissions refer to direct emissions from company-owned or controlled sources, for example, industrial or production processes, and company vehicles. Scope 2 emissions are indirect emissions from purchased electricity, steam, heating or cooling. Scope 3 emissions are defined as indirect emissions from the value chain, including suppliers and customers.
Example: A manufacturing company might report 200,000 metric tons of CO2 equivalent as part of its Scope 1 emissions per annum.
Carbon intensity
Carbon intensity is the emissions per revenue or units produced. It is measured as the ratio of GHG emissions to revenue in dollars or production volume.
Example: A logistics firm might report 0.5 metric tons of CO2 equivalent per million dollars of revenue.
Energy consumption and renewable energy use
The KPIs here are total energy usage and what percentage of the total consumption is from renewable sources like wind, solar and hydro.
Example: A technology firm sources 70% of its energy from renewable sources.
Water usage and water intensity
The water usage metric tracks the total water consumed in the production process and the intensity metric captures efficiency improvements in water usage.
Example: A beverage company reduces water use by 20% per liter of product.
Waste management and recycling
This metric measures how much waste that would normally go to a landfill gets diverted from landfills using the percent of waste recycled. It's an indicator of a company's efforts to minimize waste and integrate circular economy principles.
Example: A fashion retailer might recycle 40% of textile waste through its resale programs.
Biodiversity impact and land use
Deforestation rate and land use for operations serve as measures for biodiversity impact and land use. They measure the environmental footprint impact on ecosystems of deforestation and land conversion.
Example: A mining company might commit to zero net deforestation by 2030.
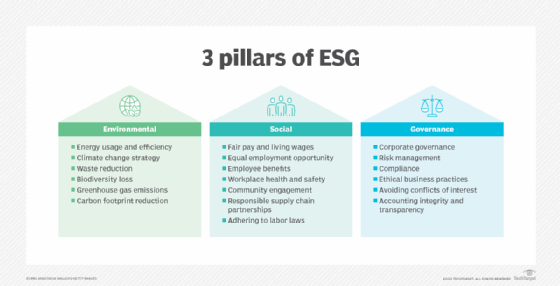
Social KPIs
The social category of metrics quantify a company's impact on its employees, on the communities in which it operates and on its consumers.
Workforce diversity and inclusion
The diversity and inclusion metrics track gender and racial representation at different seniority levels of the organization. Common metrics are the percentage of women and the percentage of minorities in leadership roles while pay equity ratios compare any wage gap based on gender.
Example: A technology company might report 30% women in executive roles, up from 20% in the previous years.
Employee health and safety
Going beyond the number of workplace accidents, organizations use metrics such as lost time injury rate (LTIR) and total recordable incident rate (TRIR) to assess workplace safety. Lost time injury refers to work-related injuries that cause an employee to miss work. LTIR is the total number of such injuries in a given year divided by the total number of hours worked by the organization's employees in that year, multiplied by 200,000. This is equivalent to 100 employees, each working 2,000 hours, so the metric gives an idea of number of lost time injuries for 100 workers.
TRIR is also calculated per 200,000 working hours (or per 100 workers) but includes the total number of recorded workplace injuries, not just those that result in time away from work. As such, TRIR will typically have a higher value than LTIR.
Lower and lower-trending values for both indicate an improvement in workplace safety.
Example: A construction firm reports an LTIR of 1.2, indicating improved safety measures, compared to the previous year's LTIR of 1.5.
Employee engagement and turnover
Employee Net Promoter Score (eNPS) is a metric that measures employee engagement and their likelihood of recommending their workplace to others. Voluntary turnover rate is also an important KPI and indicator of employee loyalty and engagement because it tracks voluntary resignations.
Example: A financial services firm's eNPS increases from 50 to 65, signalling higher employee engagement.
Human rights and labor practices
Companies want to ensure that their suppliers follow good labor practices and hence assess their suppliers for compliance with human rights standards. The metric is what percentage an suppliers an organization audits for compliance with expected and agreed-upon ethical labor practices.
Example: A retailer audits 95% of its Tier 1 (i.e., direct) suppliers for ethical labor practices.
Community investment and impact
Impact KPIs track the effectiveness of corporate social responsibility initiatives. To concretize a potentially abstract effort, it's common to use investment metrics, such as percent of revenue or profits donated, or operational metrics like volunteer hours per employee.
Example: A consumer goods company might donate 1% of its annual profits to education programs.
Data privacy and consumer protection
Digital tech has become integral to all major organizations, which broadens the number and type of personal data captured and attack surfaces hackers can potentially exploit. In response, consumer protection requires safeguarding data privacy and security. How well a company protects data is measured by the number of data breaches. Safeguarding against breaches, and reporting and addressing such breaches are required by law in many countries.
Example: A healthcare provider might report zero major data breaches in the past five years.
Governance metrics
Governance KPI focus on board oversight, ethics and risk management.
Board diversity and independence
Many organizations have set goals in terms of board composition and diversity. These are measured by metrics such as the percentage of independent board members and the percentage of women directors on the board.
Example: A manufacturing firm might report 50% board diversity, up from 35% in the previous year.
Executive compensation linked to ESG goals
A common corporate governance lever to achieve alignment on goals is to link executive compensation with meeting or exceeding said goals. Percentage of executive pay and bonuses tied to performance on ESG goals is a metric used to track how tightly leadership incentives are aligned to sustainability goals.
Example: A banking firm might tie 20% of executive bonuses to carbon-reduction goals.
Anti-corruption and ethics compliance
These measures are intended to track the efforts to prevent fraud and corruption in business practices. The metrics used are the number of bribery cases against the company and the percentage of employees trained on ethics and business code of conduct.
Example: A defense contractor requires 100% ethics training completion for all sales employees.
ESG shareholder rights and transparency
Companies measure investor engagement and transparency of governance via metrics such as the percentage of ESG-related shareholder resolutions adopted and the number of whistleblower cases.
Example: An energy company reports adopting 80% of ESG-related shareholder proposals.
Supply chain ESG risk management
These measures track how suppliers are performing with respect to organizational expectations and their sustainability and governance obligations. Percentage of suppliers meeting ESG criteria is a good indicator of this.
Example: An electronics company might remove noncompliant suppliers from its sourcing network.
While a vast number of ESG metrics exist, this article highlighted key metrics that can help business and sustainability leaders track their company performance, benchmark themselves against their industry peers and identify ESG risks early on. A well-chosen set of ESG metrics can effectively communicate progress to investors, regulators and customers.
Kashyap Kompella is an industry analyst, author, educator and AI adviser to leading companies and startups across the U.S., Europe and the Asia-Pacific regions. Currently, he is CEO of RPA2AI Research, a global technology industry analyst firm.