What is business intelligence (BI)? A detailed guide

Business intelligence, or BI, is a technology-driven data analysis process that helps an organization's executives, managers and workers make informed business decisions. As part of the BI process, relevant data is collected and prepared for analysis. Queries are run against the data, and the analytics results are used to support operational decision-making and strategic planning.
The ultimate goal of BI initiatives is to drive better business decisions that enable organizations to increase revenue, improve operational efficiency and gain competitive advantages over business rivals. To achieve that goal, BI incorporates a combination of analytics, data visualization and reporting tools, plus various methodologies for managing and analyzing data.
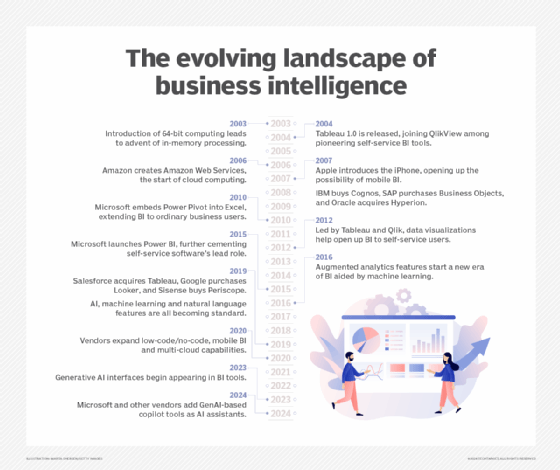
BI software emerged in the early 1990s and is widely used in organizations of all sizes. In many cases, though, how it's used has changed over the years. The development first of self-service BI tools, and more recently of augmented analytics features based on artificial intelligence (AI) and machine learning technologies, has enabled business users to analyze data themselves instead of relying on BI professionals to run queries for them.
But BI, data management and IT teams still face a variety of challenges in deploying, managing and supporting BI systems. The challenges start with getting BI programs approved and funded. Others include integrating data sets for analysis, selecting BI software, training users and keeping self-service BI implementations from devolving into chaotic environments that produce inconsistent analytics results. In many organizations, including ones that have adopted a self-service BI model, BI teams also continue to analyze data and create data visualizations, reports and BI dashboards for business users.
This comprehensive guide to business intelligence provides insight and advice on how to successfully manage BI initiatives. You'll learn more about what BI is, how it works, why it's important to organizations and its business benefits. Common BI applications and use cases, key functions of BI platforms, BI deployment best practices and current BI trends are also covered. Throughout the guide, hyperlinks point to related articles that discuss those topics and others in more depth.
How does the business intelligence process work?
Business intelligence initiatives uncover actionable information for use by senior executives, business managers and operational workers in various use cases. For example, BI applications generate insights on business performance, processes and trends, enabling management teams to identify problems and new opportunities and then take action to address them.
Business intelligence data is typically stored in a data warehouse built for an entire organization or in smaller data marts that hold subsets of business information for individual departments and business units. In addition, data lakes based on big data systems are often now used as repositories or landing pads for BI data, especially unstructured and semistructured data types. Data lakehouse platforms that combine elements of data lakes and data warehouses have also become available.
BI data can include both historical and real-time data gathered from a combination of internal IT systems and external sources. Before it's used in BI applications, raw data from different source systems usually must be integrated, consolidated and cleansed to ensure it's accurate and consistent.
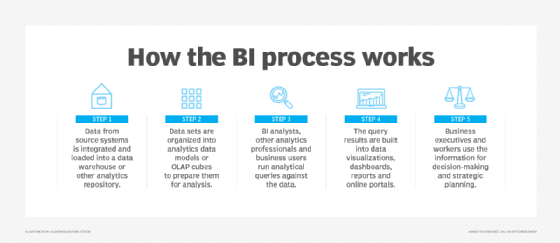
From there, the steps in the BI process include the following:
- Data preparation, in which data sets are organized, transformed and modeled for analysis.
- Analytical querying of the prepared data.
- Development of data visualizations, reports and dashboards with information on key performance indicators (KPIs) and other findings.
- Distribution of the analytics results to decision-makers, either by the BI team or self-service BI users sharing the information with business colleagues.
- Use of the performance metrics and generated insights to help inform business decisions.
BI programs sometimes also incorporate forms of advanced analytics, such as data mining, predictive analytics, text mining and statistical analysis. Predictive modeling that enables what-if analysis of different business scenarios is one example. Most commonly, though, advanced analytics projects are handled by separate data science teams, while BI teams oversee more straightforward querying and analysis of business data.
Why business intelligence is important
The main purpose of business intelligence is to improve an organization's business operations. Companies that effectively use BI tools and techniques to analyze data gain valuable insights about their business processes and strategies. The insights can then be used to optimize both strategic and tactical decision-making for accelerated business growth and increased profits.
Without BI, organizations can't readily take advantage of their data to influence decision-making. Instead, executives and workers are left to base important business decisions on accumulated knowledge, previous experience and intuition. While those methods can result in good decisions, they're also fraught with the potential for errors and missteps because of the lack of data underpinning them. BI replaces management by gut feeling with data-driven decision-making.
Benefits of business intelligence
A successful BI program produces a variety of business benefits in an organization. For example, BI enables C-suite executives and department managers to monitor business performance on an ongoing basis so they can act quickly when issues or opportunities arise. Analyzing customer data helps make marketing, sales and customer service efforts more effective. Supply chain, manufacturing and distribution bottlenecks can be detected before they cause financial harm. HR managers are better able to monitor employee productivity, labor costs and other workforce data.
Overall, the key benefits of BI applications for businesses include the ability to perform the following functions:
- Speed up and improve decision-making.
- Optimize internal business processes.
- Increase operational efficiency and productivity.
- Spot business problems that need to be addressed.
- Identify emerging business and market trends.
- Develop stronger business strategies.
- Drive higher sales and new revenues.
- Gain a competitive edge over rival companies.
BI initiatives also provide narrower business benefits -- among them, making it easier for project managers to track the status of business projects and for organizations to gather competitive intelligence on their rivals. In addition, BI, data management and IT teams themselves benefit from business intelligence by using it to analyze various aspects of technology and analytics operations.
What is a BI platform, and what are its core functions?
BI tools evolved from earlier decision support systems that vendors began developing in the 1960s. Those systems were designed primarily to funnel information to senior business executives; in fact, executive information systems were one product category that preceded business intelligence. In contrast, modern BI platforms have broader functions and user bases.
In a 2024 report on BI platforms, Gartner listed a set of core capabilities in addition to querying and analysis that include data preparation, data visualization, reporting and governance. Collaboration, automated insight generation and data storytelling -- which combines visualizations and text narratives in presentations for business users -- were among other common features it cited. Most BI vendors now also offer conversational interfaces based on generative AI (GenAI) and natural language query (NLQ) technologies to simplify data analysis tasks, the consulting and market research firm said.
Besides GenAI and NLQ, the expanding list of augmented analytics features in BI platforms includes AI-driven technologies that help users find relevant data, prepare it for analysis and create visualizations. For example, machine learning models can automate data cleansing and transformation work. AI can recommend appropriate charts and other graphics for visualizing data. Machine learning can also be used to identify trends, patterns and outliers in data sets for users to analyze.
The following are the major business intelligence functions that are supported by BI platforms.
Business monitoring and measurement. BI systems are widely used to track KPIs and other business metrics so executives can continuously monitor the performance of an organization. Doing so helps them identify and address business issues more proactively than they could in the past when performance reports were less timely. For example, a BI tool could show that product sales were below plan in one region, enabling managers to take steps to boost them in time to meet the quarterly goal.
Data analysis. Beyond just tracking metrics, BI tools support more involved analytics applications. As mentioned previously, business users and BI professionals run queries to analyze data for insights on business operations, strategies and trends. This function is the linchpin of data-driven decision-making processes in organizations.
Reporting and information delivery. BI results must be made available to business users so they can put the information to use. Initially, that was primarily done through static reports, often sent out in printed form. Reports are still widely used, but BI dashboards have become increasingly popular. They offer a more visual and interactive interface with built-in data visualizations and the ability to drill down into the underlying data for more analysis. Online portals are another BI information delivery option.
Predictive analysis. Conventional BI is a form of descriptive analytics. By analyzing historical data or real-time data streams, it examines things that have already happened or are happening now so an enterprise can respond as needed. On the other hand, predictive analytics forecasts future scenarios, such as how customers will react to marketing offers. Running predictive models and what-if queries adds a predictive element to the BI process.
Types of business intelligence tools and applications
Business intelligence combines a broad set of data analysis applications designed to meet different information needs. Most are supported by both self-service BI and traditional BI platforms. The following list comprises the principal BI technologies available to organizations.
Ad hoc analysis. Also known as ad hoc querying, ad hoc analysis is one of the foundational elements of modern BI applications and a key feature of self-service BI tools. It's the process of writing and running queries to analyze specific business issues. While ad hoc queries are typically created on the fly, they often end up being run regularly, with the analytics results incorporated into dashboards and reports.
Online analytical processing. One of the early BI technologies, OLAP tools enable users to analyze data along multiple dimensions, which is particularly suited to complex queries and calculations. In the past, the data had to be extracted from a data warehouse and stored in multidimensional OLAP cubes, but it's increasingly possible to run OLAP analyses directly against columnar databases.
Mobile BI. Mobile business intelligence makes BI applications and dashboards available on smartphones and tablets. Often used more to view data than to analyze it, mobile BI tools typically are designed with an emphasis on ease of use. For example, mobile dashboards might only display two or three data visualizations and KPIs so they can easily be viewed on a device's screen.
Real-time BI. In real-time BI applications, data is analyzed as it's created, collected and processed. Doing so gives users an up-to-date view of business operations, customer behavior, financial markets and other areas of interest. The real-time analytics process often involves streaming data and supports activities such as credit scoring, stock trading and targeted promotional offers.
Operational intelligence. Also called operational BI, OI is a form of real-time analytics that delivers information to managers and frontline workers in business operations. OI applications are designed to aid in operational decision-making and enable faster action on issues -- for example, helping call center agents to resolve problems for customers and logistics managers to ease distribution bottlenecks.
Embedded analytics. Also referred to as embedded BI, embedded analytics puts BI and data visualization functionality directly into business applications, such as ERP and CRM systems. That enables business users to analyze data within the applications they use to do their jobs instead of switching to a separate BI tool. Embedded analytics features are most commonly incorporated by application software vendors, but organizations can also include them in homegrown applications.
Open source BI. Business intelligence software that is open source typically includes two versions: a community edition that can be used free of charge and a subscription-based commercial release with technical support provided by the vendor. In addition, some vendors of proprietary BI tools offer free editions, primarily for individual users.
Collaborative BI. This is more of a process than a specific technology. It involves combining BI applications and collaboration tools to enable different users to work together on data analysis tasks and share information. For example, users can annotate BI data and analytics results with comments, questions and highlighting via the use of online chat tools.
Location intelligence. A specialized form of BI, location intelligence enables users to analyze location and geospatial data, with map-based data visualization functionality incorporated. It offers insights on geographic elements in business data and operations. Potential uses include site selection for retail stores and corporate facilities, location-based marketing and logistics management.
Customer intelligence. Another specialized process, customer intelligence analyzes customer data to gain insights about the behavior and preferences of customers. Organizations use it to improve interactions with customers, deliver personalized customer experiences and optimize marketing campaigns through segmentation techniques.
Corporate performance management. Also a subset of BI, corporate performance management involves monitoring and analyzing financial performance based on KPIs such as revenue, profits and operational costs. Senior executives are the primary users of CPM applications to support financial planning, budgeting, risk management and other corporate functions.
How industries use BI tools
The following are some examples of how business intelligence is used in different industries:
- Banks use BI to help assess financial risks when deciding whether to approve mortgage and loan applications. They and other financial services firms also analyze customer portfolios to help plan cross-selling efforts aimed at getting customers to buy additional products.
- Insurers similarly rely on BI tools to analyze risks when considering applications for life, auto and homeowners insurance policies. In addition, they tap BI to analyze policy pricing.
- Manufacturers use BI software to aid in production planning, purchasing of materials and supplies, supply chain management and monitoring of manufacturing operations.
- Retailers plan marketing campaigns and product promotions with the aid of BI and analytics tools while also using them in inventory management and product replenishment.
- Hotel chains use BI tools to track room occupancy rates and adjust pricing based on booking demand, and to help manage their customer loyalty programs.
- Airlines likewise employ BI to help track ticket sales and flight occupancy, as well as for things such as managing flight schedules, crew assignments and food and beverage ordering.
- Transportation companies plan distribution schedules and routes with guidance from BI and analytics tools. They also use BI to monitor gas mileage and other aspects of fleet operations.
- Hospitals use BI systems to analyze patient outcomes and readmission rates as part of efforts to improve patient care. In addition, doctors use the tools to analyze clinical data and help diagnose medical conditions.
What other technologies does a BI environment include?
There's more to business intelligence environments than the BI software itself. For example, a typical BI architecture also incorporates internal source systems and external data sources; data warehouses and other data repositories; and a variety of data processing and data management tools.
Here are more details on those core BI components.
Data sources. These primarily include an organization's transaction processing and operational systems, such as ERP, CRM, finance, HR and supply chain management applications. Market data, outside customer lists and other external data sets can also be collected in BI systems for analysis.
Data stores. As mentioned previously, data from source systems is typically consolidated into a data warehouse for analysis, although data marts, data lakes and data lakehouses are also used as repositories. In addition, a BI architecture might include an operational data store as a staging area for data before it goes to a data warehouse. Metadata repositories, business glossaries and data catalogs are related technologies that can help users find relevant data sets for BI applications. Two newer ones are analytics catalogs, which store dashboards, reports and curated data sets, and metrics stores, which are centralized repositories for business metrics to ensure they're consistent across an organization.
Data integration and data quality software. Extract, transform and load tools are the primary means of integrating data for BI uses. ETL pulls together data sets from source systems in batch processes at regular intervals, then transforms the data and loads it into a data warehouse. Other integration methods include real-time data integration and data virtualization, which creates blended views of data sets without physically loading them into a data warehouse. Data profiling and cleansing typically are done in conjunction with integration, using separate data quality tools to identify and fix data errors.
Data preparation and curation tools. BI and data management teams often also deploy specialized data preparation software to help automate that task and the process of curating data sets for BI users. Data curation streamlines and focuses analytics work by providing data sets that are ready to use for specific BI applications.
Organizational challenges of BI
One of the dangers of BI applications is that the accelerated decision-making they enable could lead organizations astray if it's based on faulty or incomplete data and inaccurate analytics results. To prevent that from happening, the top challenges of BI initiatives that need to be addressed include a combination of data management and BI project management issues.
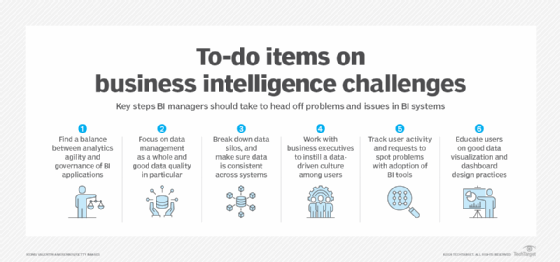
The following are some of those challenges:
- Integrating data from different source systems. Many organizations need to integrate data from various sources, including a mix of cloud and on-premises systems. That's often a complicated process.
- Identifying and fixing data quality issues. BI applications require high-quality data, but raw data often has quality issues. Processes to fix data errors and stop them from occurring are a key element of BI initiatives.
- Breaking down data silos. Siloed systems block BI users from accessing relevant data and lead to inconsistent analytics results. Eliminating them and adopting internal data standards to ensure consistency need to be priorities for BI teams.
- Managing self-service BI deployments. Uncontrolled use of self-service BI tools can also lead to conflicting analytics results that hamper effective decision-making.
- Avoiding bad data visualization and dashboard design practices. Poorly designed data visualizations and dashboards reduce BI's effectiveness, too. Business users should be trained on how to create easy-to-grasp visualizations and dashboard design best practices.
- Connecting BI-generated insights to business actions. Presenting information to executives and operational workers in a useful way can be difficult to manage. Considerations include both how and where it's presented to help drive decisions and other actions.
- Delivering the right data to business decision-makers. Similarly, customizing insights and information for different business users is a necessary but often time-consuming task. Giving users superfluous data can overload them with information.
- Justifying investments in new BI projects. Measuring the ROI of BI programs can be a struggle in some organizations. As a result, making the case for additional investments to expand BI initiatives might not be easy.
User adoption issues are another potential roadblock to successful BI initiatives. They can result from business users being reluctant to give up familiar tools, particularly spreadsheets, and switch to BI software. In addition, creating a data-driven culture remains an ongoing challenge in some organizations.
How to implement a BI program
Setting up a business intelligence program starts with developing a BI strategy. A well-planned strategy lays the foundation for effective BI initiatives that produce the expected business benefits in an organization. The following are some of the key steps to take in building a BI strategy:
- Align the strategy to business goals and related metrics. BI initiatives need to align with an organization's goals and strategic objectives, as well as the KPIs and other metrics that are used to track progress toward achieving them.
- Identify and prioritize planned BI use cases. There are numerous potential BI applications in a typical company. They can't all be funded and deployed at once, so prioritizing them based on business needs and expected ROI is a must-do item.
- Build strong data management processes. A successful BI strategy requires solid data management to make relevant, high-quality data available for BI applications. In addition to data integration, preparation and quality management processes, data governance is needed to ensure that BI data is trustworthy and used properly throughout an organization.
- Select the right BI tools. Having well-managed data isn't enough; BI users also require software that meets their needs and delivers the desired analytics results. In some cases, that might mean using multiple BI tools to support different applications and groups of users.
- Create a BI team. Especially in large companies, business intelligence teams typically include various BI roles and responsibilities. There's a BI director or manager, sometimes at the vice president level, plus positions such as BI architect, BI project manager, BI developer and BI analyst. Some of the roles might need to be combined into one position in smaller organizations.
Read more about BI analysts and how to become one
Essential business intelligence skills for BI analysts
Business intelligence analyst interview questions and answers
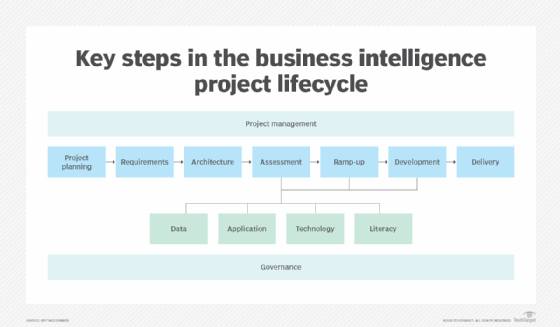
With the BI strategy and team in place, an organization can begin to implement BI applications. Doing so also involves a series of steps: creating a project plan, gathering detailed user requirements, building the underlying BI architecture, assessing organizational readiness for the project, filling identified gaps and then designing and deploying the BI system.
Business intelligence trends
The most notable trend in business intelligence is the growing use of AI tools in BI initiatives. The proliferation of augmented analytics capabilities in BI systems now also includes GenAI copilot tools that function as AI assistants for data exploration and analysis, as well as features that use GenAI to explain analytics results. In addition, AI and machine learning algorithms can help in BI applications that support activities such as supply chain optimization, customer analytics and anomaly detection for managing business risks.
Other current business intelligence trends that bear watching include the following:
- An increased focus on governing BI use. New regulatory requirements and the constant threat of cyberattacks are making data governance, security and privacy even more critical concerns in BI initiatives than they were in the past. That has raised the stakes on the overall governance of BI environments. The analytics catalogs now supported by BI vendors are on technology that can help ensure users only access information that's relevant and appropriate to their roles.
- Emergence of new analytics approaches. New forms of analytics continue to emerge in connection with the BI process. For example, composable analytics supports modular development of BI applications using sets of building blocks from different tools. Decision intelligence is an emerging field that combines elements of data science, AI and BI to accelerate decision-making and tracking of performance metrics. Another new approach is continuous intelligence, which aims to deliver real-time analytics and data insights on an ongoing basis.
- Low-code and no-code development. Many BI vendors are adding graphical tools that enable BI applications to be developed with little or no coding. Because such tools don't require high-level development skills, business users can do at least some development work themselves.
- Efforts to improve data literacy. With self-service BI broadening the use of business intelligence tools in organizations, it's critical to ensure that new users can understand and work with data. That's prompting BI teams to include data literacy skills in user training programs. BI vendors have also launched initiatives, such as the Qlik-led Data Literacy Project.
- Shift to the cloud. BI systems initially were slow to move to the cloud, partly because data warehouses were primarily deployed in on-premises data centers. But cloud deployments of both data warehouses and BI tools have grown significantly. Cloud-based BI platforms, once a separate product category, are now the primary deployment choice for many organizations.
Business intelligence vendors and market
Self-service BI and data visualization tools have become the standard for modern BI software. All major BI tools now incorporate self-service features, such as visual data discovery, ad hoc querying and augmented analytics capabilities, along with data visualization and dashboard design functions.
While full-featured platforms are the most widely used business intelligence technology, the BI market also includes other product categories. Some vendors offer tools specifically for embedded analytics uses. Some focus on dashboard and data visualization design, while others specialize in tools that support data storytelling efforts.
There are dozens of vendors overall. The following is an alphabetical list of 20 prominent BI tools; it was compiled by Donald Farmer, principal of consultancy TreeHive Strategy, based on the breadth and depth of the product offerings as well as market recognition, including vendor rankings by Gartner and Forrester Research. Vendors are listed in cases where they aren't included in the product name:
- Alibaba Cloud Quick BI.
- Amazon QuickSight (AWS).
- Domo.
- GoodData.
- IBM Cognos Analytics.
- Incorta.
- Looker (Google).
- Microsoft Power BI.
- MicroStrategy.
- Oracle Analytics Cloud.
- Pyramid Decision Intelligence Platform.
- Qlik Sense.
- SAP Analytics Cloud.
- SAS Visual Analytics.
- Sisense.
- Spotfire.
- Tableau (Salesforce).
- Tellius.
- ThoughtSpot.
- Yellowfin (Idera Inc.).
BI vs. big data analytics
Big data analytics is another widely used data analysis process. BI and big data analytics complement each other, and sets of big data can be integrated into BI processes. For example, some types of data that are initially stored in a data lake can be structured and moved to a data warehouse for use in BI applications. This can be done within the same platform in a data lakehouse.
Overall, though, the two processes target different kinds of analytics uses. BI primarily focuses on descriptive analytics and diagnostic analytics; it looks at what happened previously or is happening now and why. Big data analytics, on the other hand, usually involves predictive analytics and prescriptive analytics, which provides guidance on how to achieve desired business outcomes. BI can also be thought of as a structured approach to data analysis, while big data analytics is more exploratory in nature. And it's typically done by data scientists and other data analysts with advanced analytics skills.
Craig Stedman is an industry editor who creates in-depth packages of content on analytics, data management and other technology areas.