Risk assessment matrix: Free template and usage guide
A risk assessment matrix identifies issues with the greatest potential for business disruption or damage. Use our free template to prioritize risk management plans.

A risk assessment matrix is a helpful visual tool for identifying and prioritizing business risks, threats and vulnerabilities as part of a risk management program. Risk managers, business executives, cybersecurity leaders and disaster recovery teams can use an assessment matrix to categorize risks by their likelihood and potential business impact, such as financial and reputational harm to an organization.
Below you'll find a downloadable risk assessment matrix template and guidance on using it. The template provides a simple yet effective starting point for a risk assessment. Such assessments can become very complex, especially when sophisticated risk modeling algorithms are used. However, a risk matrix is typically shaped by common factors. As a result, organizations can begin with a template and customize it as needed to include the various risks being assessed and the required details about them.
Other tools for conducting risk assessments are also available, including risk analysis software and applications for creating a risk register to document and track different risks. The nature of a planned assessment and the level of detail to be provided will help determine both the final design of the risk assessment matrix and the related tools to deploy.
What a risk matrix includes
A color-coded risk assessment matrix is the most widely cited form. Also called a risk heat map, it plots risks in an X-Y matrix that measures their likelihood on one axis and their potential business impact on the other. Typically, there are equal numbers of rows and columns, but these numbers can vary. The example below shows a 5x5 risk matrix, which is a popular option. The downloadable template contains a 6x6 version, and organizations can create smaller ones, down to simple quadrants.
Each axis in such a matrix includes a scale that reflects an increasing likelihood of a risk occurring or a more severe business impact. The rows and columns are usually given corresponding numerical values. In a 5x5 matrix, for example, a risk's likelihood can be rated from 1 for improbable or very unlikely to 5 for frequent or very likely. Similarly, its impact can be scored from 1 for negligible to 5 for catastrophic. Multiplying the two scores for each field in the matrix provides numerical values that can be used to categorize low, medium, high and critical risks, with color coding to further visualize the different categories.

Another type of matrix is a risk assessment calculation table, one of which is also included in the template. Instead of an X-Y plot, it lists risks or risk events on different rows in the table. The likelihood and impact severity of the risks are listed as columns, which can also include other metrics. For example, the table in the template adds a financial impact column. Numerical scores are entered into each field in a row and multiplied to calculate a risk factor that's used to categorize the various risks.
Importance of performing a risk assessment
An organization's risk management team uses the results of a risk assessment to prioritize different business risks and develop plans to deal with them. The assessment provides information on situations or possible scenarios that threaten the success of business initiatives before they're launched, during an initiative and even after it's completed. Risk assessments can also help disaster recovery teams ensure they complete a business continuity project or activity on time and within the allotted budget.
Without the insights generated by a comprehensive risk assessment, risk and business leaders are left to evaluate potential risks in a vacuum, with only previous experience and gut feelings to guide them. On the other hand, an assessment enables an organization to create a risk profile based on a quantitative analysis of the risks it could encounter. The profile can then be used to decide how to respond to different risks.
As mentioned above, the primary metrics to use when conducting a risk assessment are the likelihood of a risk event occurring and the likely impact to a project or business activity if the event occurs. External sources of risk data are also available, such as published insurance risk tables and actuarial tables. These sources can provide valuable data to help inform an assessment and give risk decision-makers better information.
Why use a risk assessment matrix?
There are many factors to consider during a risk assessment. A risk assessment matrix organizes risk data and other elements of an assessment to help streamline the process and make the results easier to understand. Using a matrix can also help an organization do the following:
- Define the different types of risk it faces.
- Identify relevant business assets for the assessment.
- Determine the criticality of the assets.
- List the specific risks and threats to the assets.
- Determine the criticality of the identified risks.
- Calculate the organization's tolerance for each risk to help plan controls.
- Validate the effectiveness of current controls and risk mitigation strategies.
- Identify potential new mitigation strategies, technologies and methods.
- Calculate overall risk values for the organization, such as residual risk.
 Click here to download
our free risk assessment
matrix template.
How to use the risk assessment matrix template
The color-coded risk assessment matrix provided in the downloadable template is relatively simple and straightforward to use. Once business risks have been identified, you need to assess their likelihood and potential impact, assign the appropriate numerical rankings and then plot them in the corresponding fields of the matrix. When all the risks being assessed have been plotted, the results can be used to prioritize them and create a plan for managing them.
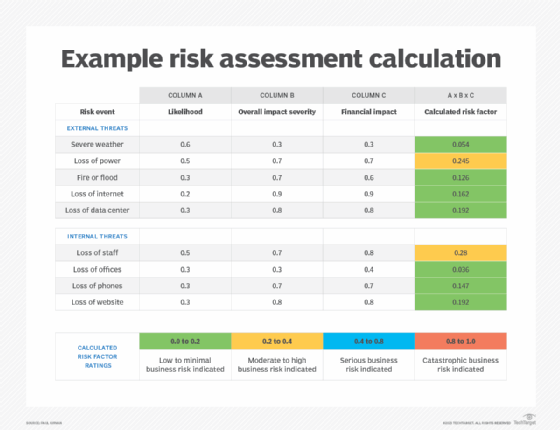
The second part of the download is the ready-to-use calculation table for conducting a risk assessment that includes likelihood, overall impact severity and financial impact. In that example, the likelihood rating in column A ranges from 0.0 for no likelihood of occurrence to 1.0 for 100% likelihood. The same numerical weightings are used to rate the overall impact severity in column B and the financial impact in column C. Using additional factors, such as the latter, can produce a more realistic calculated risk factor.
More complex assessment values can also be substituted for the 0.0 to 1.0 range. After deciding on a numerical scale and inserting the assessed values into the fields in each row, multiply the values in columns A, B and C to calculate the individual risk factors. Once that's done, apply the color-coded risk priority ratings that follow the assessment table to the final column to provide a visual representation of the calculated risk factors. An example of a completed risk assessment calculation table is included in the template and shown below to demonstrate how the process works.
Risk factor ratings are arbitrary ranges that can vary by process, so be sure that senior management reviews and approves any metrics before a risk assessment is done. But the two matrix options outlined here should give organizations a good start on assessing risks for enterprise risk management programs and disaster recovery initiatives.
Applying the risk matrix template in different types of organizations
The risk assessment matrix template can be used by companies in various vertical markets. The risk event entries in the template likely will vary, at least somewhat, from industry to industry. Even within the same industry, they'll differ based on the specific risk profile of individual businesses.
For example, a risk assessment calculation table for an organization based in a hurricane zone with backup systems in the cloud could look like the example provided in the template. As part of the data-gathering process for the assessment, the risk management team in this scenario should examine relevant data on weather and natural disasters from government agencies, such as the National Oceanic and Atmospheric Administration, the National Weather Service and the National Hurricane Center.
The team should also review risk data from the company's cloud services provider and cloud industry organizations such as the Cloud Security Alliance. Among other things, this data could include the number and duration of previous outages that the cloud services provider has experienced in the regions where the company operates.
In addition to potential financial risks, some of the common risk types that can be incorporated into an assessment matrix include the following:
- Operational risk.
- Strategic risk.
- Legal risk.
- Compliance risk.
- Personnel risk.
- Cybersecurity risk.
- Technology risk.
- Reputational risk.
How to communicate a risk matrix to business stakeholders
Detailed risk analysis and creation of a risk assessment matrix aren't likely to be regular activities for most senior executives and business managers. As a result, when risk management professionals explain a completed matrix to key business stakeholders, presenting the data in their language is essential. This means addressing issues such as the importance of effective risk management to the organization, what the results mean in business terms and how the information in the matrix can help protect the business from the assessed risks.
The following actions can help ensure that the risk assessment matrix is understood -- and well received -- by business leaders who weren't involved in developing it:
- Understand the audience, including knowledge of their responsibilities and risk tolerance levels.
- Use clear business language and avoid technical jargon.
- Explain the strategic importance of risk management and how it aligns with the organization's business goals.
- Outline the basics of the risk analysis process.
- Use both quantitative and qualitative data, plus visuals where appropriate.
- Describe how the matrix's results can provide a good ROI by helping to protect revenue and ensure business resilience, customer trust and regulatory compliance.
- Encourage open discussion, while keeping the presentation as simple and concise as possible.
Editor's note: This article was updated in August 2025 to add new information.
Paul Kirvan, FBCI, CISA, is an independent consultant and technical writer with more than 35 years of experience in business continuity, disaster recovery, resilience, cybersecurity, GRC, telecom and technical writing.