logistic regression
What is logistic regression?
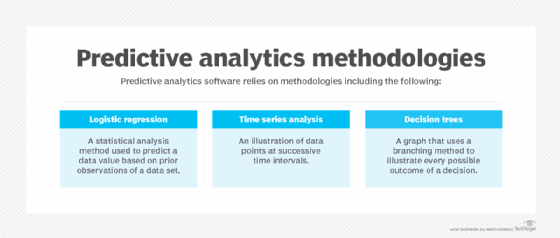
Logistic regression, also known as a logit model, is a statistical analysis method to predict a binary outcome, such as yes or no, based on prior observations of a data set.
A logistic regression model predicts a dependent data variable by analyzing the relationship between one or more existing independent variables. For example, logistic regression could be used to predict whether a political candidate will win or lose an election or whether a high school student will be admitted to a particular college. These binary outcomes enable straightforward decisions between two alternatives.
A logistic regression model can take into consideration multiple input criteria. In the case of college acceptance, the logistic function could consider factors such as the student's grade point average, SAT score and number of extracurricular activities. Based on historical data about earlier outcomes involving the same input criteria, it then scores new cases on their probability of falling into one of two outcome categories.
Because of its simplicity, interpretability and effectiveness in addressing binary classification challenges, logistic regression is extensively employed across various industries such as marketing, finance and medicine. For example, it can be used in predicting certain scenarios such as the risk of an illness, credit default and customer churn.
How does logistic regression work in machine learning and predictive modeling?
Logistic regression in machine learning has gained a lot of importance as a supervised learning algorithm. It lets algorithms used in machine learning applications classify incoming data based on historical data. As additional relevant data comes in, the algorithms get better at predicting classifications within data sets.
In machine learning, logistic regression is categorized as a discriminative model since it's focused on distinguishing between classes or categories. In contrast to generative model algorithms, including naïve Bayes, it doesn't generate data or visuals for representing the predicted probabilities or class, such as a picture of a cat.
Logistic regression can also play a role in data preparation activities by enabling data sets to be put into specifically predefined buckets during the extract, transform, load process to stage the information for analysis.
Regression is a cornerstone of modern predictive analytics applications.
"Predictive analytics tools can broadly be classified as traditional regression-based tools or machine learning-based tools," said Donncha Carroll, a partner in the revenue growth practice of Lotis Blue Consulting.
Regression models represent or encapsulate a mathematical equation approximating the interactions between the modeled variables. Machine learning models use and train on a combination of input and output data as well as use new data to predict the output.
What is the purpose of logistic regression?
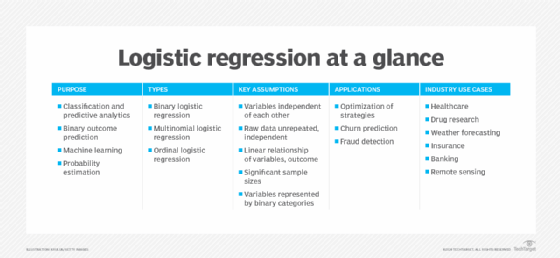
Logistic regression serves several key purposes in statistical analysis, classification and predictive analytics:
- Classification and predictive analytics. Logistic regression streamlines the mathematics for measuring the effect of multiple variables (e.g., age, gender, ad placement) with a given outcome (e.g., click-through, ignore). The resulting models can carefully separate the relative effectiveness of various interventions for different categories of people, such as young/old or male/female.
- Binary outcome prediction. Logistic regression is ideal for analyzing scenarios with a binary dependent variable, predicting possible outcomes such as yes or no based on previous data. Its effectiveness in this regard makes it a staple in fields such as marketing, finance and data science.
- Machine learning. Logistic models can also transform raw data streams to create features for other types of AI and machine learning techniques. In fact, logistic regression is one of the commonly used algorithms in machine learning for binary classification problems, which are problems with two class values, including predictions such as this or that, yes or no, and A or B.
- Probability estimation. Logistic regression can also estimate the probabilities of events, including determining a relationship between features and the probabilities of outcomes. That is, it can be used for classification by creating a model that correlates the hours studied with the likelihood the student passes or fails. On the flip side, the same model could be used for predicting whether a particular student will pass or fail when the number of hours studied is provided as a feature and the variable for the response has two values: pass and fail.
What are the types of logistic regression?
Logistic regression comes in three types:
- Binary logistic regression. In binary or binomial logistic regression, the response variable can only belong to two categories, such as yes or no, 0 or 1, or true or false. For example, predicting whether a customer will purchase a product only has two outcomes: yes or no. Binary logistic regression is one of the most used classifiers for binary classification and the most frequently utilized method in logistic regression.
- Multinomial logistic regression. This type of logistic regression is used when the response variable can belong to one of three or more categories and there is no natural ordering among the categories. An example predicting the genre of a movie a viewer is likely to watch from a set of options.
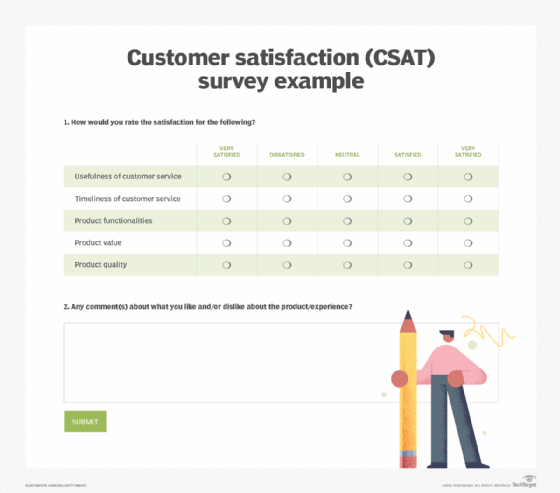
- Ordinal logistic regression. This type of regression is suitable when the response variable belongs to one of three or more categories and there is a natural ordering among them. For instance, a company might use ordinal logistic regression for predicting whether customer satisfaction levels will be low, medium or high.
Example of a logistic regression formula and model
The logistic regression model uses the logistic function to predict the probability of the occurrence of an event based on the values of the independent variables. Examples include predicting if a crack greater than a certain size will occur in a manufactured specimen, if a student will pass or fail a test, or if a survey respondent will select yes or no on a survey.
The probability is calculated using the logistic function, also known as the sigmoid function, which ensures that the output is bounded between 0 and 1.
An example of a logistic function formula can be the following.
P = 1 ÷ (1 + e^ − (a + bx))
Here is what each variable stands for in this logistic regression equation:
- P is the probability of the dependent variable being 1.
- e is the base of the natural logarithm.
- a is the intercept or the bias term.
- b is the coefficient for the independent variable.
- x is the value of the independent variable.

What are the key assumptions of logistic regression?
Statisticians and citizen data scientists must keep a few assumptions in mind when using different types of logistic regression techniques:
- Variables must be independent of each other. For starters, the variables must be independent of one another. For example, zip code and gender could be used in a model, but zip code and state would not work. Other less transparent relationships between variables might get lost in the noise when logistic regression is used as a starting point for complex machine learning and data science applications. For example, data scientists might spend considerable effort to ensure that variables associated with discrimination, such as gender and ethnicity, are not included in the algorithm. However, these can sometimes get indirectly woven into the algorithm via variables that were not thought to be correlated, such as zip code, school or hobbies.
- Raw data should represent unrepeated or independent phenomena. Another assumption is that the raw data should represent unrepeated or independent phenomena. For example, a survey of customer satisfaction should represent the opinions of separate people. However, these results would be skewed if someone took the survey multiple times from different email addresses to qualify for a reward.
- The relationship between the variables and the outcome should be linearly related. It's also important that the relationship between the variables and the outcome can be linearly related via logarithmic odds or log odds, which is a bit more flexible than a non-linear relationship.
- Logistic regression also requires a significant sample size. Logistic regression also requires a significant sample size. This can be as small as 10 examples of each variable in a model. However, this requirement goes up as the probability of each outcome drops.
- Each variable can be represented using binary categories. Another assumption with logistic regression is that each variable can be represented using binary logistic regression categories such as male or female and click or no-click. A special trick is required to represent categories with more than two classes. For example, one might transform one category with three age ranges into three separate variables, where each specifies whether an individual is in that age range.
Logistic regression applications in business
Logistic regression has various applications in the business domain. Notable use cases of logistic regression include the following:
- Optimization of strategies. Organizations use insights from logistic regression outputs to enhance their business strategy for achieving business goals such as reducing expenses or losses and increasing ROI in marketing campaigns. An e-commerce company that mails expensive promotional offers to customers, for example, would want to know whether a particular customer is likely to respond to the offers or not (i.e., whether that consumer will be a responder or a non-responder). In marketing, this is called propensity to respond modeling. Likewise, a credit card company will develop a model to help it predict if a customer is going to default on its credit card based on characteristics such as annual income, monthly credit card payments and the number of defaults. In banking parlance, this is known as default propensity modeling.
- Churn prediction. Logistic regression helps businesses with predicting customer churn or subscription cancellation by examining historical data and various pertinent factors associated with customer behavior. These factors might include demographic information, purchase history, frequency of interactions, customer satisfaction scores and engagement metrics. By analyzing these variables, logistic regression models can identify patterns and relationships that correlate with the likelihood of churn.
- Fraud detection. In the finance industry, logistic regression is applied to detect fraudulent transactions. By analyzing transaction amounts and credit scores, logistic regression models can assess the probability of a transaction being fraudulent, contributing to enhanced fraud detection measures.
Logistic regression industry use cases
Logistic regression has become particularly popular in online advertising, helping marketers predict the likelihood of specific website users who will click on particular advertisements as a yes or no percentage.
Logistic regression can also be used in the following industries:
- Healthcare industry. Logistic regression can be used in healthcare to identify risk factors for diseases and plan preventive measures.
- Drug research. It can be used in drug research to tease apart the effectiveness of medicines on health outcomes across age, gender and ethnicity.
- Weather forecasting. Logistic regression is used in weather forecasting apps to predict snowfall and weather conditions.
- Political polls. Logistic regression can be used in political polls to determine if voters will vote for a particular candidate.
- Insurance industry. It is used in insurance to predict the chances that a policyholder will die before the policy's term expires based on specific criteria, such as gender, age and physical examination.
- Banking. Logistic regression can be used in banking to predict the chances that a loan applicant will default on a loan or not, based on annual income, past defaults and past debts.
- Remote sensing. In remote sensing, logistic regression is utilized to analyze satellite imagery, effectively categorizing land cover types such as forests, agricultural lands, urban areas and water bodies.
Advantages and disadvantages of logistic regression
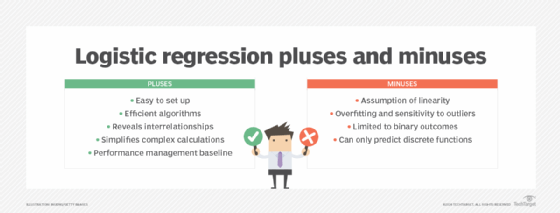
Logistic regression offers the following advantages:
- Easy to set up. The main advantage of logistic regression is that it is a simple model which is much easier to set up and train than other machine learning models such as neural networks and AI applications.
- Efficient algorithms. Another advantage is that it is one of the most efficient algorithms when the different outcomes or distinctions represented by the data are linearly separable. This means that you can draw a straight line separating the results of a logistic regression calculation.
- Reveals interrelationships between variables. One of the biggest attractions of logistic regression for statisticians is that it can help reveal the interrelationships between different variables and their effect on outcomes. This could quickly determine when two variables are positively or negatively correlated, such as the finding cited above that more studying tends to be correlated with higher test outcomes. But it is important to note that other techniques such as causal AI are required to make the leap from correlation to causation.
- Transforms complex calculations into simple math problems. Logistic regression transforms complex calculations around probability into a straightforward arithmetic problem. The calculation itself is complex, but modern statistical methods and applications automate much of the calculations. This dramatically simplifies analyzing the effect of multiple variables and minimizes the effect of confounding factors. As a result, statisticians can quickly model and explore the contribution of various factors to a given outcome. For example, a medical researcher might want to know the effect of a new drug on treatment outcomes across different age groups. This involves a lot of nested multiplication and division for comparing the outcomes of young and older people who never received a treatment, younger people who received the treatment, older people who received the treatment and then the whole spontaneous healing rate of the entire group. Logistic regression converts the relative probability of any subgroup into a logarithmic number, called a regression coefficient, that can be added or subtracted to arrive at the desired result. These more straightforward regression coefficients can also simplify other data science and machine learning algorithms.
- Baseline for performance management. Logistic regression is often used as a baseline to measure performance due to its quick and easy setup.
Logistic regression also comes with various disadvantages:
- Assumption of linearity. Since logistic regression assumes a linear relationship between one dependent variable and the independent variables, its applicability in certain scenarios may be limited.
- Overfitting and sensitivity to outliers. Logistic regression is sensitive to outliers. If the number of observations is lesser than the number of features, logistic regression should not be used; otherwise it might lead to overfitting. L1 and L2 regularization techniques can be applied to help reduce overfitting.
- Limited to binary outcomes. Logistic regression is limited to modeling binary classification and outcomes and might not be suitable for scenarios with non-binary outcomes without modifications such as ordinal logistic regression.
- Can only predict discrete functions. Logistic regression is exclusively designed for predicting discrete functions, which constrains its use to dependent variables within a discrete number set. This limitation poses challenges for predicting continuous data.
Logistic regression tools and software
Logistic regression calculations were a laborious and time-consuming task before the advent of modern computers. Today, modern statistical analytics tools such as SPSS and SAS include logistic regression capabilities as an essential feature.
Data science programming languages and frameworks built on R and Python include numerous ways of performing logistic regression and weaving the results into other algorithms. For example, Python offers various libraries such as Statsmodels, scikit-learn and TensorFlow for executing logistic regression, and R provides packages such as glm, lrm and GLMNET for logistic regression analysis.
Other commonly used tools and software for performing logistic regression include the following:
- Microsoft Excel. A popular spreadsheet software that can perform basic statistical analysis and modeling.
- Solver. This is an add-in tool within Excel for solving optimization issues, including determining a logistic model's best-fit parameters. There are various methods by which Solver can be utilized to automate logistic regression.
- IBM SPSS. A drag-and-drop data science tool, IBM SPSS lets users create and train machine learning and artificial intelligence models including logistic regression. It offers a versatile, hybrid cloud environment for creating models and analyzing data.
- NCSS software. This software offers a full array of regression analysis tools and procedures including logistic regression.
- Unistat Statistics software. Unistat Statistics software offers a comprehensive application of receive operating characteristic (ROC) analysis within the logistic regression process. It enables the calculation of area under the curve and the drawing of ROC curves with variables.
- Amazon SageMaker. Amazon SageMaker is a fully managed ML service that offers built-in algorithms for linear regression and logistic regression. It helps data scientists prepare, build and train data as well as deploy logistic regression models instantly.
Managers should also consider other data preparation and management tools as part of significant data science democratization efforts. For example, data warehouses and data lakes can organize larger datasets for analysis. Data catalog tools can surface any quality or usability issues associated with logistic regression. Data science platforms can help analytics leaders create appropriate guardrails to simplify the broader use of logistic regression across the enterprise.
Logistic regression vs. linear regression
When comparing logistic regression and linear regression models, it's important to understand their key differences and applications. The main differences between logistic and linear regression include the following:
- Logistic regression provides a constant output, while linear regression provides a continuous output.
- In logistic regression, the outcome, or dependent variable is dichotomous and has only two possible values. However, in linear regression, the outcome is continuous, which means that it can have any one of an infinite number of possible values.
- Logistic regression is used when the response variable is categorical, such as yes or no, true or false, and pass or fail. Linear regression is used when instead of a categorical variable, the response variable is continuous, such as hours, height and weight. For example, given data on the time a student spent studying and that student's exam scores, logistic regression and linear regression can predict different outcomes.
- With logistic regression predictions, only specific values or categories are permissible. Therefore, logistic regression predicts whether the student passed or failed. Since linear regression predictions are continuous, such as numbers in a range, it can predict the student's test score on a scale of 0 to 100.
- Logistic regression is commonly used for classification tasks such as predicting whether an email is spam by studying its predictor variables and features. Linear regression is typically used for tasks such as predicting future sales based on historical data.
Organizations trying to control and manage risks can benefit from using accurate risk prediction models. Examine various risk prediction models and the advantages businesses can derive from using them.