
What is a decision tree in machine learning?
A decision tree is a flow chart created by a computer algorithm to make decisions or numeric predictions based on information in a digital data set.
Decision trees can be used for both classification and regression tasks. They're considered a branch of artificial intelligence (AI) and supervised learning, where algorithms make decisions based on past known outcomes. The data set containing past known outcomes and other related variables that a decision tree algorithm uses to learn is known as training data.
In a credit line application, for example, the results of the training, or fitting, stage in a decision tree is when the algorithm learns a flow chart from a data set. The target, or y, variable is the decision to accept or deny past credit applicants. The decision is based on other data, such as credit score, number of late payments, current debt burden, length of credit history, account balances and similar information, all contained in a training data set. The debt-to-income (DTI) ratio measures an applicant's debt burden. If an applicant has an income of $100,000 and an outstanding debt of $500,000, for example, then the DTI ratio is 5.
Why are decision trees used in machine learning?
Decision trees are widely used in machine learning (ML) because of their ability to handle diverse data types, capture nonlinear relationships and provide clear, explainable models. Other key reasons that make decision trees a popular choice for ML include the following:
- They provide a clear visual representation of the entire decision-making process. This makes decision trees highly interpretable and easy to understand even for nontechnical stakeholders.
- Because decision trees can be used for both classification and regression tasks, they can be useful for a variety of ML tasks.
- They are easy to understand and interpret. The treelike structure in which they model decisions and their possible consequences is intuitive and straightforward.
- They can provide insights into the importance of different features, which helps identify the variables that are the most influential in making predictions.
- Decision trees can manage various data types, including numerical, categorical and textual data. This flexibility makes them applicable to a wide range of data sets.
- They are reliable compared to some other methods, making them a good choice for messy data sets.
- Unlike some other ML algorithms, decision trees don't require normalization or scaling of features. This simplifies the preprocessing step in ML.
- They're relatively simple to set up and understand compared to more complex ML algorithms. This makes decision trees a popular choice for rapid prototyping and beginners.
Decision tree components and terminology
Key components and terminology associated with decision tree include the following:
- Root node. This is the topmost node in the decision tree and represents the entire data set.
- Splitting. Splitting is the process of dividing a node into two or more subsets or subnodes.
- Decision node. When a subnode further splits into additional subnodes, these new nodes are referred to as decision nodes or internal nodes.
- Leaf node. These are the final nodes in the tree that represent the final class label or decision.
- Branch. These are the paths that connect the nodes and represent the different possible outcomes of the test.
- Pruning. This process removes branches of the decision tree to prevent overfitting and improve generalization.
- Parent node. This refers to nodes that precede other nodes in the tree hierarchy. Specifically, they're the nodes from which one or more child nodes or subnodes emerge.
- Child node. These nodes are directly connected to the parent node, resulting from the split or decision made at the parent node.
Decision tree example and diagram
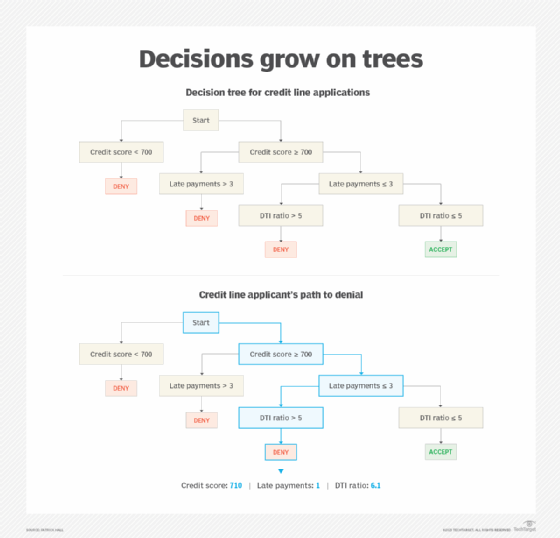
The decision tree structure shown in Figure 1 has three levels based on three different variables in the example training data set: credit score, late payments and DTI ratio. At the top of the tree, the internal decision points and the outcome decisions are often referred to as nodes. This tree has one root node labeled "Start," four leaf nodes labeled as "Accept" or "Deny," and six internal nodes that contain the variables. Leaf nodes, sometimes known as terminal nodes, contain the decisions.
The credit score, late payments and DTI ratio selected by the decision tree learning are some of the more important variables in this data set. They interact in meaningful ways to yield the decision to accept or deny a credit application. The decision tree algorithm also lists the important split points that indicate creditworthiness: A credit score of 700, three or fewer late payments and a DTI ratio of 5.
The process of running a data point -- a single applicant's data -- through the tree to arrive at a decision is called scoring or inference. Available applicant information, such as credit score, late payments and DTI ratio, is run through the decision tree to arrive at a uniform and systematic lending decision.
Data scientists can use the decision tree for single applications, as shown at the bottom of Figure 1, or to score entire portfolios of consumers quickly and automatically.
Advantages of using a decision tree
Decision trees aren't restricted to financial applications. They work well for many traditional business applications based on structured data, which are columns and rows of data stored in database tables or spreadsheets. Decision trees can provide many advantages, including the following:
- They're flexible and come in many forms for most business decision-making applications.
- They use heterogeneous data such, as numeric and textual data.
- They use dirty data that doesn't need a lot of cleaning or standardization.
- They use missing data values in their training process.
- They don't take much time to train or score new data -- unlike other types of ML models.
- They're considered explainable, or glass-box, models that are structured for direct interpretability. Explainable models are more easily verified and debugged by data scientists and more likely to be approved and adopted for business applications than some of their more complex ML cousins.
- There are many free and commercial software packages that offer different settings and types of decision tree algorithms.
- They provide insights into feature selection and importance, helping users understand which features have the most influence on the prediction or outcome.
Decision trees are versatile and have many applications across various domains due to their adaptability. For example, they can be used in healthcare for disease diagnosis, finance for credit scoring, marketing for customer segmentation and natural language processing for sentiment analysis.
Disadvantages of using a decision tree
Decision trees have their share of flaws, including the following:
- Decision tree training processes tend to be "greedy" because the tree learns from the top down -- one decision point at a time -- without considering the entire tree structure.
- Decision trees can be sensitive to small changes in the training data, leading to instability in the model. Greedy training processes can lead to instability, as adding just a few more rows of training data and refitting the tree can lead to an entirely different structure.
- Decision trees tend to perform poorly on pattern recognition tasks in unstructured data, such as images, videos, raw text and sound. Those applications need deep neural networks.
- Decision trees can struggle to capture complex, nonlinear relationships in the data, especially when the underlying patterns aren't easily expressed as a series of if-then rules.
- Decision trees can be computationally demanding if there are too many features. Applying feature reduction techniques might be necessary for large data sets.
Optimal decision trees can fix greediness and instability issues, but they tend to be available in academic software that's more difficult to use.
Classification vs. regression decision trees
As mentioned above, decision trees can be used for both classification and regression tasks. However, the main difference between the two lies in the type of target variable they're designed to predict:
- Classification decision trees
- These are used to predict a categorical target variable -- for example, whether an email is spam or not or to which species of flower a plant belongs.
- The output of a classification decision tree is a class label, representing the predicted category.
- The goal of classification decision trees is to create a model that can accurately classify new, unseen data into the correct categories.
- Examples of classification decision trees include solving classification problems, such as predicting whether a loan applicant will default or classifying images of different types of animals.
- Regression decision trees
- Regression decision trees are used for predictive modeling or predicting a continuous numerical target variable, such as the price of a car or the sales of a product.
- The output of a regression decision tree is a numerical value, representing the predicted quantity.
- The goal of the regression tree is to create a model that can accurately estimate the value of the target variable for new and unseen data.
- Examples of regression decision trees can include predicting the temperature of a patient or the fuel efficiency of a car.
Types of decision tree algorithms
There are many decision trees within two main types: classification and regression. Each subcategory of a decision tree has customizable settings, making them a flexible tool for most supervised learning and decision-making applications.
One way to differentiate the type of decision tree used is whether the prediction is a categorical variable and classification outcome -- for example, lend: yes, no; and letter grade: A, B, C, D or F -- or a numeric variable and numeric outcome -- for example, how much to lend and numeric grade. Decision trees that predict numeric outcomes are sometimes known as regression trees.
Besides classification and regression decision trees, other common types of decision tree algorithms include the following:
- Iterative Dichotomiser 3. ID3 was developed by Ross Quinlan in 1986. This algorithm uses the information gain metric to determine the best feature to split on at each node. It continues splitting until all instances are perfectly classified or no further useful features are available. ID3 is prone to overfitting and can create huge trees.
- C4.5. Ross Quinlan developed this algorithm as an improvement over ID3. It uses the gain ratio metric instead of information gain to account for the number of branches in a feature. It handles both categorical and continuous data and prunes trees to avoid overfitting, which makes it better at handling noisy data.
- Classification And Regression Trees. The CART algorithm was developed by Leo Breiman, Jerome Friedman, Richard Olshen and Charles Stone. CART can be used for both classification and regression problems and uses Gini impurity for classification and mean squared error for regression. It provides clear and interpretable models, and trees are pruned to prevent overfitting. The pruned trees tend to be simpler and more generalizable.
- Multivariate adaptive regression splines. MARS was developed by Jerome Friedman and is primarily used for regression. It builds models by fitting piecewise linear regressions and combining them into a single model. MARS is capable of modeling complex, nonlinear relationships and interactions between features.
- Chi-square automatic interaction detection. CHAID was developed by Gordon Kass and uses chi-squared tests to find the best split. It's typically used for categorical variables and can handle multiway splits. CHAID handles categorical data nicely and can produce trees that are easier to interpret.
Decision tree algorithms, such as CART and C4.5, use characteristics such as finding the most important variables, locating split points and selecting a final tree structure to distinguish themselves from one another. There are also many free and commercial software packages that offer various settings and types of algorithms.
While there might be a specific reason to use a certain type of decision tree, it's sometimes necessary to try different algorithms and settings to determine what works best for a specific business problem and data set. Some decision tree software even lets data scientists add their own variables and split points by collaborating interactively with the decision tree algorithm. Other popular ML algorithms are based on combinations of many decision trees.
Best practices for making an effective decision tree
Creating an effective decision tree involves careful consideration of various factors to ensure the model is accurate, interpretable and generalizable.
The following are key steps and best practices to follow when creating a decision tree:
- Define clear objectives. The objectives of creating a decision tree should be clearly articulated along with its scope. This helps narrow the focus of the analysis and guarantees that the decision tree answers all the pertinent queries.
- Gather quality data. Precise and pertinent data that covers all relevant aspects should be collected, as it's necessary for constructing and evaluating the decision tree.
- Keep it simple. The decision tree structure should be kept as simple as possible, avoiding unnecessary complexity that could confuse users or obscure important decisions.
- Engage the stakeholders. Stakeholders who will be affected by or involved in the decision-making process should be engaged. The stakeholders should understand the construction of the decision tree so they can offer input on relevant factors and predict outcomes.
- Validate and verify the information. The data used to build the decision tree should be validated to ensure it's accurate and reliable. Using techniques such as cross-validation or sensitivity analysis to verify the comprehensiveness of the tree should help.
- Provide intuitive visualization. Clear and intuitive visualization of the decision tree should be used. This aids in understanding how decisions are made and enables stakeholders to follow the logic easily.
- Consider risks. Probabilities of outcomes should be incorporated, and uncertainties in data or assumptions should be considered. This approach helps with making informed decisions that account for potential risks and variability.
- Validate and test. The decision tree should be validated against real-world data and tested with different scenarios to ensure it's reliable and provides meaningful insights.
Alternatives to using a decision tree
Decision trees are a versatile tool for classification and regression, but alternative methods can be more suitable depending on the specific needs or problems at hand.
The following are some alternatives to decision trees:
- Random forest. Random forests can be considered an alternative to using standalone decision tree models. A random forest algorithm takes the mode or average decision from many individual decision trees to achieve an outcome. Interesting mathematical outcomes can happen when many simpler models are combined. Due to their mathematical properties and the overall flexibility of decision trees, random forests are one of the easiest ML algorithms to use.
- Gradient boosting machine. A GBM starts with a regular decision tree and then uses a series of additional trees to improve upon the outcome of the single tree. Though much more temperamental than a single decision tree or random forest, GBMs tend to be one of the more accurate ML algorithms for business data mining applications.
- Support vector machine. An SVM is a supervised learning algorithm that finds the hyperplane that best separates classes in the feature space. It can be used for both classification and regression tasks.
- Neural network. A neural network is composed of layers of interconnected nodes or neurons that learn hierarchical data representations by passing signals forward through the network and adjusting weights through backpropagation.
It's important to note that ensemble models, including random forests and GBMs, improve the stability of single decision trees, but they're also much less explainable than single trees.
Explore the different types of ML models and the key factors necessary for training the optimal model for your specific needs.