
overfitting in machine learning

What is overfitting in machine learning?
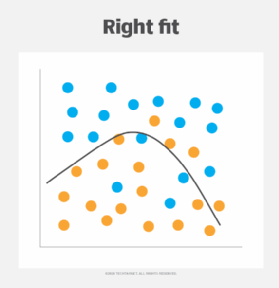
Overfitting in machine learning occurs when a model excessively fits the training data, capturing both relevant patterns and inconsequential noise, resulting in inaccurate predictions of new data. Simpler models are less susceptible to capturing noise or irrelevant patterns, which increases the likelihood of generalizing effectively to unseen data.
For example, imagine a company using machine learning to select a few candidates to interview from a large set of resumes based solely on the resume content. The model can consider relevant factors, such as education, experience and skills. However, it overly fixates on font choices, rejecting highly qualified applicants for using Helvetica rather than Times New Roman.
Why does overfitting occur?
Most factors contributing to overfitting can be found in the model, data or training methods. If a machine learning model is too complex, it memorizes training data closely rather than learning the relevant underlying pattern.

If the training data contains too much noise or if the training data set is too small, the model does not have enough good data to distinguish between signal and noise. If a model trains for too long -- even with optimized data and model -- it starts learning noises, reducing performance the longer it trains. Another potential pitfall is repeatedly testing a model on the same validation data, leading to implicit overfitting to a stale data set.
Overfitting vs. underfitting
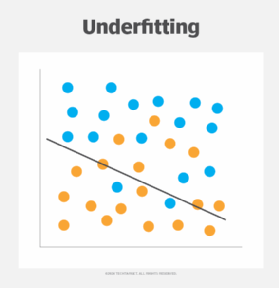
Underfitting is the opposite of overfitting in that the machine learning model doesn't fit the training data closely enough, thus failing to learn the pattern in the data. Underfitting can be caused by using a too-simple model for a complex problem.
In the above example where a company evaluates resumes with machine learning, an underfit model is too simplistic and fails to capture the relationship between resume contents and job requirements. For example, the underfit model may select all resumes containing specific keywords, such as Java and JavaScript, even if only JavaScript skills are required for the position. The learning model focuses too much on just the word Java, and skills are completely different for JavaScript. It then fails to detect suitable candidates in the training and new data.
How to detect overfit models
One sign of an overfit model is when it performs well on the training data but poorly on new data. However, there are other methods to test the model's performance more effectively.
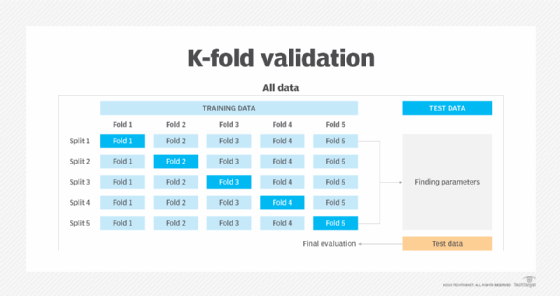
K-fold cross-validation is an essential tool in assessing the performance of a model. The training data is randomly split into K subsets of equal size, referred to as folds. One fold is reserved for final validation, and the model is trained on the remaining folds. The model then validates the remaining fold and calculates the performance metrics. This process is performed K times, using a different fold as the validation fold during each iteration. The performance metrics are then averaged to get a single overall performance measure for the model.
Technically, two learning curves are generated for one analysis. One learning curve is generated on the training data set to evaluate how the model is learning, and the other curve is generated on the validation set, which evaluates how well the model is generalizing to new data. Then, the learning curves plot performance metrics, such as error or accuracy, against the number of training data points.
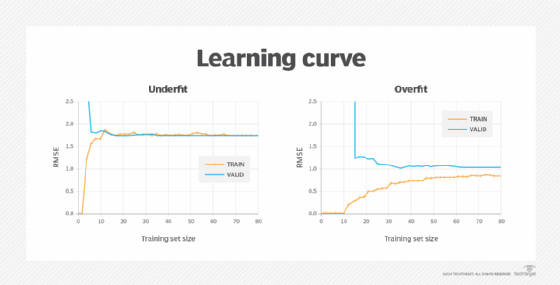
As the data set increases, patterns in the performance metrics begin to emerge. When the training error and the validation error plateau, that indicates that adding more data does not meaningfully change the fit. A learning curve for an underfitting model trends close and high. A learning curve for an overfitting model contains lower error values, but there is a gap between the validation and training results, indicating the model is underperforming on the validation data.
Organizations must improve the model and data to prevent overfitting in machine learning.
Improve the model
Here are some ways to refine and optimize models to decrease the risk of overfitting in machine learning.
Simpler models
Understanding the problem and selecting the appropriate machine learning algorithm are crucial at the beginning of a project. While cost evaluation and performance optimization are important, beginners should start with the simplest algorithm to avoid complications and improve generalization. Simple algorithms, such as k-means clustering or k-nearest neighbors, offer more straightforward interpretation and debugging.
Feature selection
In machine learning, features are the individual measurable properties or characteristics of the data used as inputs for training a model. Feature selection identifies which features are the most useful for the model to learn, which reduces the model's dimensionality.
Regularization
The risk of overfitting increases with the complexity of the model. Regularization is putting constraints on that model during training to avoid complications.
During the training process, the weights of the machine learning model -- or coefficients -- are adjusted to minimize the loss function, which represents the difference between the predicted outputs of a model and the actual target values. The loss function can be represented by the following:
min⍵→L(⍵→)
Regularization adds a new term α|| ⍵→ || to the loss function and then solves for the set of weights that minimizes the output.
min⍵→L(⍵→) + α|| ⍵→ ||
There are different ways to do this, depending on the model type.
Ridge regression
Ridge regression is a linear regression technique that adds the sum of the squares of the weights to the loss function during training, aiming to prevent overfitting by keeping the coefficients as small as possible without reducing them to zero.

LASSO regression
Least absolute shrinkage and selection operator (LASSO) regression adds the sum of the absolute values of the model's weights to the loss function. This automatically performs feature selection by eliminating the weights of the least important features.

Elastic net regression
Elastic net regression adds a regularization term that is the sum of ridge and LASSO regression, introducing the hyperparameter γ, which controls the balance between ridge regression (γ = 1) and LASSO regression (γ = 0) and determines how much automatic feature selection is done on the model.

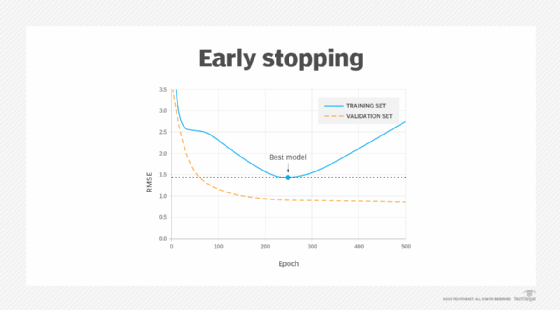
Early stopping
This method works for iterative learning algorithms, such as gradient descent. A model learns with more data. As the model learns and more data is provided, the prediction error on both the training and validation sets goes down. When too much data is added, overfitting begins to occur, and the error rate on the validation set starts to increase. Early stopping is a form of regularization that stops model training once the validation data's error rate reaches its minimum or when a plateau is detected.
Dropout
Dropout is a regularization technique used in deep neural networks. Each neuron has a probability -- known as the dropout rate -- that it is ignored or "dropped out" at each data point in the training process. During training, each neuron is forced to adapt to the occasional absence of its neighbors and rely more on its inputs. This leads to a stronger, more resilient network with reduced susceptibility to minor input variations, which minimizes the risk of the network mistaking noise for meaningful data. Adjusting the dropout rate can address overfitting by increasing it or underfitting by decreasing it.
Ensemble methods
Ensemble methods aggregate predictions from multiple models toward the end of a machine learning project, which reduces both bias and variance, leading to more comprehensive predictions. An example of an ensemble method is random forests, which build multiple decision trees during training. Each tree is trained on a random subset of the data and features. During prediction, the random forest aggregates the predictions of individual trees to produce a final prediction, often achieving high accuracy and robustness against overfitting.
Improve the data
The data is just as vital as the model, so organizations can do the following to improve data.
Training with more data
A large training data set provides a more comprehensive representation of the underlying problem, enabling the model to learn the true patterns and dependencies rather than memorizing specific instances.
Data augmentation
Data augmentation helps reduce overfitting by copying one training data instance and then altering it slightly so it is learnable to the model but not detectable by a human. The model has more opportunities to learn the desired pattern, while increasing its tolerance for different environments. Data augmentation is especially helpful in balancing a data set because it includes more underrepresented data, helping to improve the model's ability to generalize across diverse scenarios and avoid biases in the training data.