Windows 7 performance monitoring tools
Use updated tools such as Performance Monitor, Resource Monitor or Task Manager to focus on specific performance aspects and capabilities while enhancing and measuring system performance.
We often wonder why our workaday computer chores seem to take just as long as they ever did, despite the fact that hardware is generally more reliable and more powerful than ever. The answer to this apparent riddle comes in the form of McFedries' law of computing codependence: The increase in software system requirements is directly proportional to the increase in hardware system capabilities. For example, imagine that a slick new chip is released that promises a 10% speed boost; software designers, seeing the new chip gain wide acceptance, add 10% more features to their already bloated code to take advantage of the higher performance level. Then another new chip is released, followed by another software upgrade—and the cycle continues ad nauseum as these twin engines of computer progress lurch codependently into the future.
So, how do you break out of the performance deadlock created by the immovable object of software code bloat meeting the irresistible force of hardware advancement? By optimizing your computer to minimize the effects of overgrown applications and to maximize the native capabilities of your hardware. Of course, it helps if your operating system gives you a good set of tools to improve and monitor performance, diagnose problems, and keep your data safe. Windows XP came with a decent set of client tools, Vista improved on them (although not with anything radically new or earth shattering), and Windows 7 stays the course.
Computer Performance Monitor Capabilities
Performance optimization is a bit of a black art in that every user has different needs, every configuration has different operating parameters, and every system can react in a unique and unpredictable way to performance tweaks. That means if you want to optimize your system, you have to get to know how it works, what it needs, and how it reacts to changes. You can do this by just using the system and paying attention to how things look and feel, but a more rigorous approach is often called for. To that end, the next few sections take you on a brief tour of Windows 7's performance monitoring capabilities.
Viewing Your Computer's Performance Rating
Like Windows Vista, Windows 7 tailors certain aspects of itself to the capabilities of the system on which you're installing it. For example, the Windows 7 interface changes depending on the graphics hardware on the machine, with low-end machines getting the Windows 7 Basic theme, and high-end GPUs getting the full Aero treatment.
About the book
This chapter excerpt on Tuning Windows 7's Performance (download PDF) is taken from the book Microsoft Windows 7 Unleashed. This book goes deep into Windows 7 and covers everything from security settings to startup optimization and networking. Author Paul McFedries introduces new styles and techniques to maximize your Windows 7 performance.
But Windows 7 also scales other aspects up or down to suit its hardware home. With games, for example, Windows 7 enables certain features only if the hardware can support them. Other features scaled for the computer's hardware are TV recording (for example, how many channels can it record at once?) and video playback (for example, what is the optimal playback size and frame rate that doesn't result in dropped frames?).
The tool that handles all of this, not only for Windows 7 itself but also for third-party programs, is the Windows System Assessment Tool, or WinSAT. This tool runs during setup, and again whenever you make major performance-related hardware changes to your system. It focuses on four aspects of computer performance: graphics, memory, processor, and storage. For each of these subsystems, WinSAT maintains a set of metrics stored as an assessment in XML format. Windows 7 needs to examine only the latest assessment to see what features the computer can support. Note, too, that third-party programs can use an application programming interface that gives them access to the assessments, so developers can tune program features depending on the WinSAT metrics.
Five metrics are used:
- Processor—This metric determines how fast the system can process data. The Processor metric measures calculations per second processed.
- Memory (RAM)—This metric determines how quickly the system can move large objects through memory. The Memory metric measures memory operations per second.
- Graphics—This metric determines the computer's capability to run a composited desktop like the one created by the Desktop Window Manager. The Graphics metric expresses frames per second.
- Gaming Graphics—This metric determines the computer's capability to render 3D graphics, particularly those used in gaming. The Gaming Graphics metric expresses effective frames per second.
- Primary Hard Disk—This metric determines how fast the computer can write to and read from the hard disk. The Primary Hard Disk storage metric measures megabytes per second.
In addition to WinSAT, Windows 7 comes with the Performance Rating tool that rates your computer based on its processor, RAM, hard disk, regular graphics, and gaming graphics. The result is the Windows Experience Index base score.
To launch this tool, select Start, type performance, and then click Performance Information and Tools in the search results. In the Performance Information and Tools window, if you see a button named Rate this Computer, click that button to run the initial assessment.
As you can see in Figure 6.1, Windows 7 supplies a subscore for each of the five categories and calculates an overall base score. You can get a new rating (for example, if you change performance-related hardware) by clicking the Re-run the Assessment link.
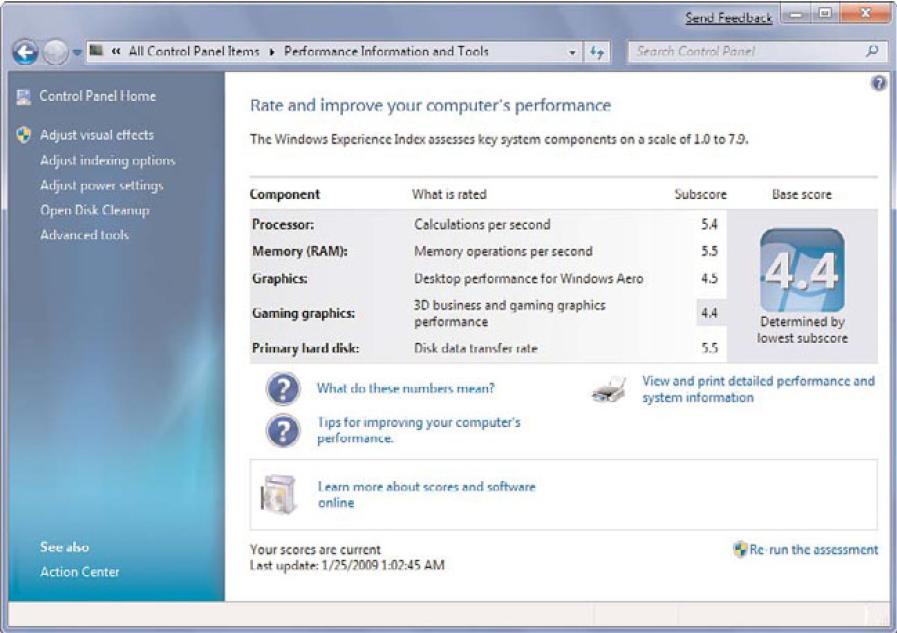
FIGURE 6.1 Windows 7 calculates a Windows System Performance Rating based on five categories.
Interpreting the ratings is a bit of a black art, but I can tell you the following:
-
- In general, the higher the rating, the better the performance.
- The lowest possible value is 1.0.
- The highest possible value is 7.9 (up from 5.9 in Windows Vista, which is a reflection of hardware improvements over the past few years).
- The base score takes a weakest-link-in-the-chain approach. That is, you could have nothing but 5.0 scores for everything else, but if you get just 1.0 because your notebook can't do gaming graphics, your base score will be 1.0.
- In general, the higher the rating, the better the performance.
Computer Performance Monitoring with Task Manager
The Task Manager utility is excellent for getting a quick overview of the current state of the system. To get it onscreen, press Ctrl+Alt+Delete to open the Windows Security screen and then click the Start Task Manager link.
Tip
To bypass the Windows Security screen, either press Ctrl+Shift+Esc, or right-click an empty section of the taskbar and click Start Task Manager.
The Processes tab, shown in Figure 6.2, displays a list of the programs, services, and system components currently running on your system. (By default, Windows 7 shows just the process you have started. To see all the running processes, click Show Processes from All Users.) The processes display in the order in which they were started, but you can change the order by clicking the column headings. (To return to the original, chronological order, you must shut down and restart Task Manager.)
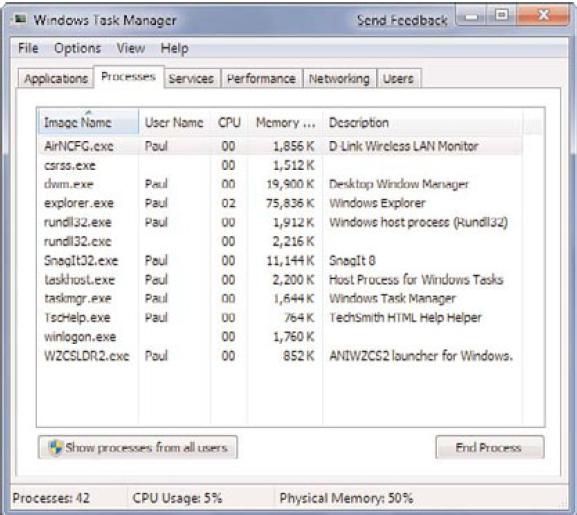
FIGURE 6.2 The Processes tab lists your system's running programs and services.
In addition to the image name of each process, the user who started the process, and a description of the process, you see two performance measures:
-
- CPU—The values in this column tell you the percentage of CPU resources that each process is using. If your system seems sluggish, look for a process consuming all or nearly all the resources of the CPU. Most programs will monopolize the CPU occasionally for short periods, but a program that is stuck at 100 (percent) for a long time most likely has some kind of problem. In that case, try shutting down the program. If that doesn't work, click the program's process and then click End Process. Click the Yes button when Windows 7 asks whether you're sure that you want to do this.
- Memory—This value tells you approximately how much memory a process is using. This value is less useful because a process might genuinely require a lot of memory to operate. However, if this value is steadily increasing for a process that you're not using, it could indicate a problem and you should shut down the process.
- CPU—The values in this column tell you the percentage of CPU resources that each process is using. If your system seems sluggish, look for a process consuming all or nearly all the resources of the CPU. Most programs will monopolize the CPU occasionally for short periods, but a program that is stuck at 100 (percent) for a long time most likely has some kind of problem. In that case, try shutting down the program. If that doesn't work, click the program's process and then click End Process. Click the Yes button when Windows 7 asks whether you're sure that you want to do this.
Tip
The four default columns in the Processes tab aren't the only data available to you. Select the View, Select Columns command to see a list of more than two dozen items that you can add to the Processes tab.
The Performance tab, shown in Figure 6.3, offers a more substantial collection of performance data, particularly for that all-important component, your system's memory.
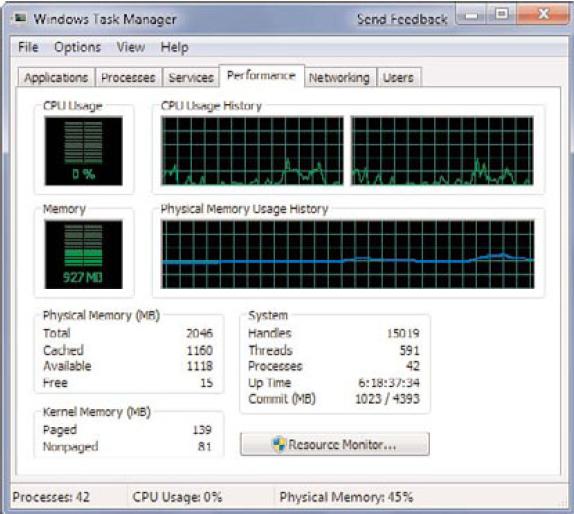
FIGURE 6.3 The Performance tab lists various numbers related to your computer's memory components.
The graphs show you both the current value and the values over time for the CPU usage (the total percentage of CPU resources that your running processes are using) and the physical memory usage. Below the graphs are various numbers. Here's what they mean:
- Physical Memory Total—The total amount of physical RAM in your system.
- Physical Memory Cached—The amount of physical RAM that Windows 7 has set aside to store recently used programs and documents.
- Physical Memory Free—The amount of physical RAM that Windows 7 has available for your programs. Note that Windows 7 does not include the system cache (refer to the previous item) in this total.
- Kernel Memory Paged—The amount of kernel memory mapped to pages in virtual memory.
- Kernel Memory Nonpaged—The amount of kernel memory that cannot map to pages in virtual memory.
- System Handles—The number of object handles used by all running processes. A handle is a pointer to a resource. For example, if a process wants to use a particular service offered by a particular object, the process asks the object for a handle to that service.
- System Threads—The number of threads used by all running processes. A thread is a single processor task executed by a process, and most processes can use two or more threads at the same time to speed up execution.
- System Processes—The number of processes currently running (that is, the number of items you see in the Processes tab if you activate the Show Processes from All Users control).
- System Up Time—The number of days, hours, minutes, and seconds that you have been logged on to Windows 7 in the current session.
- System Commit (MB)—The minimum and maximum values of the page file. What is a page file? Your computer can address memory beyond the amount physically installed on the system. This nonphysical memory is virtual memory implemented by setting up a piece of your hard disk to emulate physical memory. This hard disk storage is actually a single file called a page file (or sometimes a paging file or a swap file). When physical memory is full, Windows 7 makes room for new data by taking some data that's currently in memory and swapping it out to the page file.
Here are two notes related to these values that will help you monitor memory-related performance issues:
- If the Physical Memory Free value approaches zero, it means your system is starving for memory. You might have too many programs running or a large program is using lots of memory.
- If the Physical Memory Cached value is much less than half the Physical Memory Total value, it means your system isn't operating as efficiently as it could because Windows 7 can't store enough recently used data in memory. Because Windows 7 gives up some of the system cache when it needs RAM, close down programs you don't need.
In all of these situations, the quickest solution is to reduce the system's memory footprint by closing either documents or applications. For the latter, use the Processes tab to determine which applications are using the most memory and shut down the ones you can live without for now. The better, but more expensive, solution is to add more physical RAM to your system. This decreases the likelihood that Windows 7 will need to use the paging file, and it enables Windows 7 to increase the size of the system cache, which greatly improves performance.
If you're not sure which process corresponds to which program, display the Applications tab, right-click a program, and then click Go to Process. Task Manager displays the Processes tab and selects the process that corresponds to the program.
Using the Resource Monitor
Windows 7 comes with a new tool for monitoring your system yourself: the Resource Monitor. (It's actually a standalone (and revamped) version of the Resource Monitor from Windows Vista.) You load this tool by selecting Start, typing monitor, and then clicking Resource Monitor in the search results. Figure 6.4 shows the window that appears.

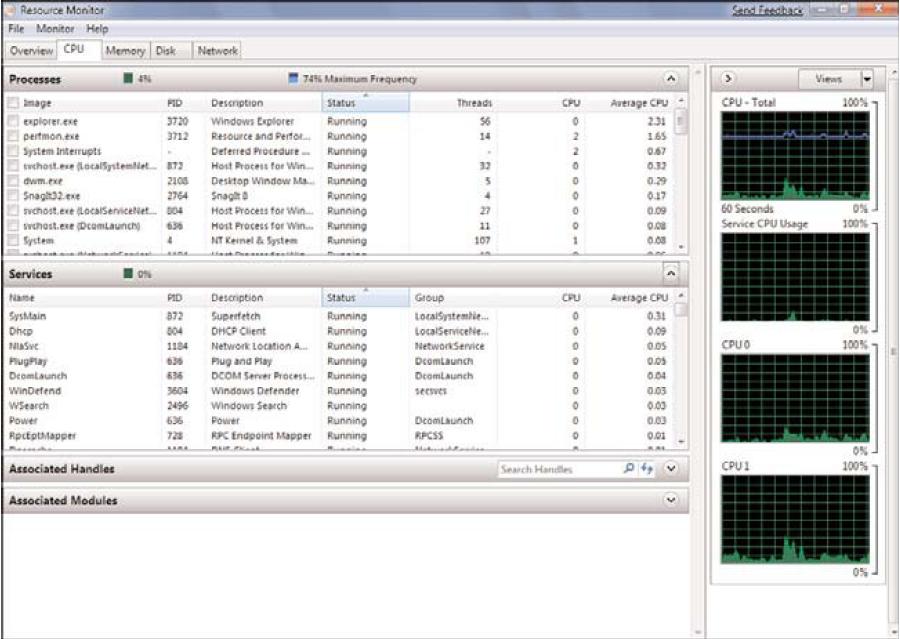
FIGURE 6.4 The new Resource Monitor enables you to monitor various aspects of your computer.
The Resource Monitor is divided into five tabs:
-
- Overview—This section shows a couple of basic metrics in four categories: CPU, Disk, Network, and Memory, as well as graphs that show current activity in each of these categories. To see more data about a category (as with the CPU category in Figure 6.4), click the downward-pointing arrow on the right side of the category header.
- CPU—This section (see Figure 6.5) shows the CPU resources that your system is using. In two lists named Processes and Services, you see for each item the current status (such as Running), the number of threads used, the CPU percentage currently being used, and the average CPU percentage. You also get graphs for overall CPU usage, service CPU usage, and CPU usage by processor (or by core).
-
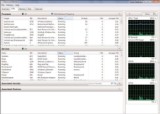
FIGURE 6.5 The CPU tab breaks down CPU usage by processes and by services.
- Memory—This tab displays a list of processes and for each one it shows the average number of hard memory faults per minute, the total memory committed to the process, the working set (the number of kilobytes resident in memory), the amount of shareable memory (memory that other processes can use if needed), and the amount of private memory (memory that is dedicated to the process and cannot be shared). Note: A memory fault does not refer to a physical problem. Instead, it means that the system could not find the data it needed in the file system cache. If it finds the data elsewhere in memory, it is a soft fault; if the system has to go to the hard disk to retrieve the data, it is a hard fault.
-
- Disk—This tab shows the total hard disk I/O transfer rate (disk reads and writes in bytes per minute), as well as separate read and write transfer rates. .
- Network—This tab shows the total network data transfer rate (data sent and received in bytes per minute).
Using the Performance Monitor
More on computer performance monitoring and management
Windows 7 Performance Monitor
Guide to Windows 7 upgrade and troubleshooting
Guide to application performance management
The Performance Monitor provides you with real-time reports on how various system settings and components are performing. You load it by selecting Start, typing performance, and then pressing Enter to choose Performance Monitor in the search results. In the Performance Monitor window, open the Monitoring Tools branch and click Performance Monitor.
Performance Monitor displays real-time data using performance counters, which are measurements of system activity or the current system state. For each counter, Performance Monitor displays a graph of recent values over a time space (the default time space is 100 seconds), as well as statistics such as the average, maximum, and minimum values over that span.
By default, Performance Monitor doesn't show any counters. To add one to the Performance Monitor window, follow these steps:
-
- Right-click anywhere inside the Performance Monitor and then click Add Counters. The Add Counters dialog box appears.
- To use the Available Counters list, click the downward-pointing arrow beside a counter category (such as Memory, Paging File, or Processor). A list of available counters appears.
- Select the counter you want to use. (If you need more information about the item, activate the Show Description check box.)
- If the counter has multiple instances, they appear in the Instances of Selected Object list. Click the instance you want to use.
- Click Add.
- Repeat steps 2–5 to add any other counters you want to monitor.
- Click OK.
The counter appears at the bottom of the window (see Figure 6.6). A different-colored line represents each counter, and that color corresponds to the colored lines shown in the graph. Note, too, that you can get specific numbers for a counter—the most recent value, the average, the minimum, and the maximum—by clicking a counter and reading the boxes just below the graphs. The idea is that you should configure Performance Monitor to show the processes you're interested in (page file size, free memory, and so on) and then keep it running while you perform your normal chores. By examining the Performance Monitor readouts from time to time, you gain an appreciation of what is typical on your system. If you run into performance problems, you can check Performance Monitor to see whether you've run into any bottlenecks or anomalies.
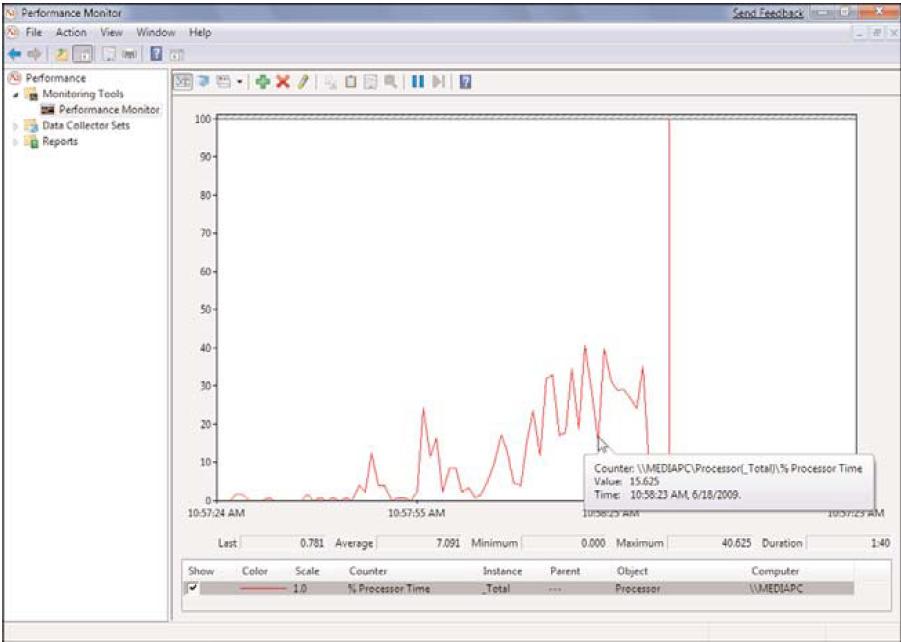
FIGURE 6.6 Use Performance Monitor to keep an eye on various system settings and components.
Performance Monitor has a few new features that make it easier to use and a more powerful diagnostics tool:
-
- If you're using a counter with a significantly different scale, you can scale the output so that the counter appears within the graph. For example, the graph's vertical axis runs from 0 to 100; if you're displaying a percentage counter, the Scale value is 1.0, which means the graph numbers correspond directly to the percentages (50 on the graph corresponds to 50%). If you're also showing, say, the Commit Limit counter, which shows values in bytes, the numbers can run in the billions. The Commit Limit counter's Scale value is 0.00000001, so the value 20 on the graph corresponds to 2 billion bytes.
- You can save the current graph as a GIF image file: right-click the graph and then click Save Image As.
- You can toggle the display of individual counters on and off. You do this by toggling the check boxes in the Show column.
- You can change the duration of the sample (the number of seconds of data that appear on the chart). Right-click the chart, click Properties, click the General tab, and then modify the Duration value. You can specify a value between 2 and 1,000 seconds.
- You can see individual data points by hovering the mouse over a counter. After a second or two, Performance Monitor displays the counter name, the time and date of the sample, and the counter value at that time (refer to Figure 6.6).
Data Collector Sets
A data collector is a custom set of performance counters, event traces, and system-configuration data that you define and save so that you can run and view the results any time you need them. You can configure a data collector set to run for a preset length of time or until the set reaches a specified size. You can also configure a data collector to run on a schedule. For example, you could run the data collector every hour for 15 minutes from 9 a.m. to 5 p.m. This enables you to benchmark performance and analyze the results not only intraday (to compare performance at different times of the day) but also interday (to see whether performance is slowing over time).
Reports
This section holds the reports created by each data collector set. These are .blg files, and you can see the results by clicking the report and then switching to Sysmon view (click the Chart icon in the toolbar). Alternatively, open the folder that contains the report file in Windows Explorer (the default save location is %SystemDrive%perflogs) and doubleclick the report file.
About the author
Paul McFedries is the president of Logophilia Limited, a technical writing company, and has been writing computer books since 1991. McFedries is the author or coauthor of more than 60 books that have sold more than 3 million copies worldwide. He is also the proprietor of Wordspy.com, a website described as "the word lover's guide to new words," which tracks new words that become part of the English language.
![]()
![]() Tuning Windows 7's performance
Tuning Windows 7's performance
![]() Windows 7 performance monitoring tools
Windows 7 performance monitoring tools
![]() Optimizing Windows 7 startup performance for energy efficiency
Optimizing Windows 7 startup performance for energy efficiency
![]() Optimizing Windows 7 application performance
Optimizing Windows 7 application performance
![]() Improving Windows 7 performance by optimizing the hard disk
Improving Windows 7 performance by optimizing the hard disk
![]() Windows 7 virtual memory performance optimization
Windows 7 virtual memory performance optimization
Printed with permission from Sams Publishing. Copyright 2009. Microsoft Windows 7 Unleashed by Paul McFedries. For more information about this title and other similar books, please visit www.pearson.com.