Monitoring VMware vSphere performance using alarms
Find out how to create and manage alarms using vCenter Server and learn the steps to configuring vCenter Server for email and notifications.
Solutions provider takeaway: This chapter excerpt helps solutions providers to create and manage alarms by using vCenter Server. You can also find out how to configure vCenter Server for email and notifications.
About the book
This chapter excerpt on Monitoring VMware vSphere 4 Performance (download PDF) is taken from the book Mastering VMware vSphere 4. The book offers guidance and insight into implementing VMware vSphere 4. Solutions providers can learn about saving their customers hardware costs during implementation, how to partition a server into several virtual machines and ways to alleviate virtual server sprawl. You can also read through chapters on installing and configuring vCenter Server and vCenter Update Manager, creating and managing virtual networks, ensuring high availability and more.
Monitoring VMware vSphere Performance
The monitoring of VMware vSphere should be a combination of proactive benchmarking and reactive alarm-based actions. vCenter Server provides both methods to help the administrator keep tabs on each of the virtual machines and hosts as well as the hierarchical objects in the inventory. Using both methods ensures that the administrator is not caught unaware of performance issues or lack of capacity.
vCenter Server provides some exciting new features for monitoring your virtual machines and hosts, such as expanded performance views and charts, and it greatly expands the number and types of alarms available by default. Together, these features make it much easier to manage and monitor VMware vSphere performance.
In this chapter, you will learn to:
- Use alarms for proactive monitoring
- Work with performance graphs
- Gather performance information using command-line tools
- Monitor CPU, memory, network, and disk usage by both ESX/ESXi hosts and virtual machines
Overview of Performance Monitoring
Monitoring performance is a key part of every vSphere administrator's job. Fortunately, vCenter Server provides a number of ways to get insight into the behavior of the vSphere environment and the virtual machines running within that environment.
The first tool vCenter Server provides is its alarms mechanism. Alarms can be attached to just about any object within vCenter Server and provide an ideal way to proactively alert the vSphere administrator about potential performance concerns or resource usage. I'll discuss alarms in greater detail later in this chapter in the section ''Using Alarms.''
Another tool that vCenter Server provides is the Resources pane on the Summary tab of both ESX/ESXi hosts and virtual machines. This Resources pane provides quick ''at-a-glance'' information on resource usage. This information can be useful as a quick barometer of performance, but for more detailed performance information you will have to search elsewhere -- either elsewhere within vCenter Server, as I'll describe later in this chapter, or within the guest operating system itself. Because this tool provides only limited information, I won't discuss it further in this chapter.
Another tool that provides ''at-a-glance'' performance summary is the Virtual Machines tab, found on vCenter Server objects, datacenter objects, cluster objects, and ESX/ESXi hosts. Figure 12.1 shows the Virtual Machines tab of a cluster object. This tab provides an overview of general performance and resource usage. This information includes CPU utilization, memory usage, and storage space utilized. As with the Resources pane, this information can be useful, but it is quite limited, so I won't discuss it any further in this chapter. However, keep in mind that a quick trip here might help you quickly isolate the one virtual machine that could be causing performance issues for the ESX/ESXi host on which it is running.
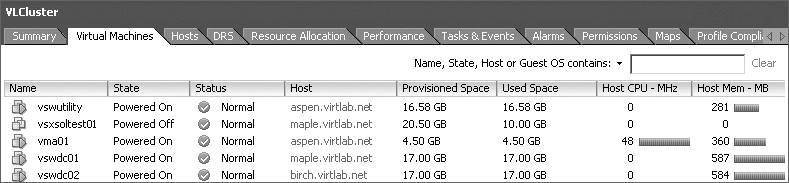
Figure 12.1
The Virtual Machines tab of a cluster object offers a quick look at virtual machine CPU and memory usage.
For ESX/ESXi clusters and resource pools, another tool you can use is the Resource Allocation tab. The Resource Allocation tab provides a picture of how CPU and memory resources are being used for the entire pool. This high-level method of looking at resource usage is useful for analyzing overall infrastructure utilization. This tab also provides an easy way of adjusting individual virtual machine or resource pool reservations, limits, and/or shares without editing each object independently.
vCenter Server also offers a very powerful, in-depth tool found on the Performance tab. The Performance tab provides a robust mechanism for creating graphs depicting the actual resource consumption over time for a given ESX/ESXi host or virtual machine. The graphs provide historical information and can be used for trend analysis. vCenter Server provides many objects and counters to analyze the performance of a single virtual machine or host for a selected interval. The Performance tab and the graphs are powerful tools for isolating performance considerations, and I discuss them in greater detail in the section ''Working with Performance Graphs.''
VMware also provides tools to run at the host level to help isolate and identify problems there. Because these tools require the presence of a Service Console, they work only with VMware ESX and not VMware ESXi. I'll take a look at these tools later in this chapter in the section ''Working with Command-Line Tools.''
Finally, I'll take the various tools that I've discussed and show how to use them to monitor the four major resources in a VMware vSphere environment: CPU, memory, network, and storage. Let's get started with a discussion of alarms.
Using Alarms
In addition to the graphs and high-level information tabs, the administrator can create alarms for virtual machines, hosts, networks, and datastores based on predefined triggers provided with vCenter Server. Depending upon the object, these alarms can monitor resource consumption or the state of the object and alert the administrator when certain conditions have been met, such as high resource usage or even low resource usage. These alarms can then provide an action that informs the administrator of the condition by email or SNMP trap. An action can also automatically run a script or provide other means to correct the problem the virtual machine or host might be experiencing.
The creation of alarms to alert the administrator of a specific condition is not new in this version of vCenter Server. But the addition of new triggers, conditions, and actions gives the alarms more usefulness than in previous editions. As you can see in Figure 12.2, the alarms that come with vCenter Server are defined at the topmost object, the vCenter Server object. You'll also note that there are far more predefined alarms in vCenter Server 4 than in previous versions of vCenter Server or VirtualCenter.
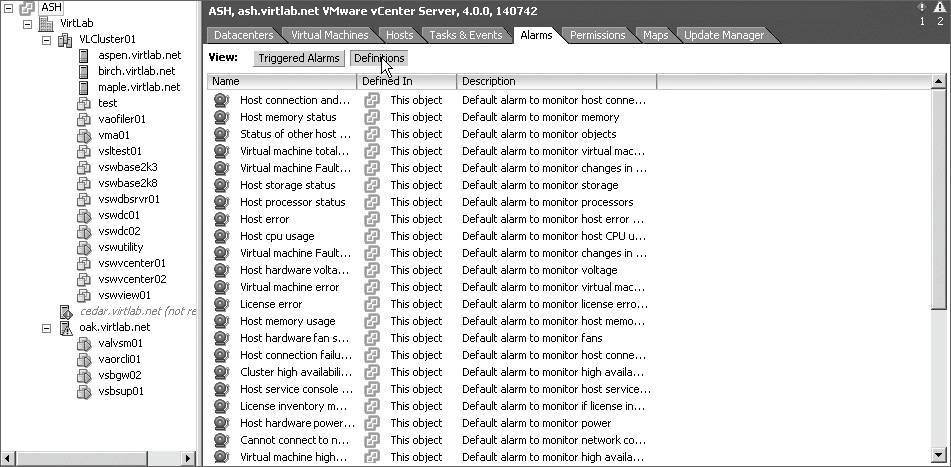
Figure 12.2
The default alarms for objects in vCenter Server are defined on the vCenter Server object itself.
These default alarms are usually generic in nature. Some of the predefined alarms include alarms to alert the administrator if any of the following happen:
- A host's storage status, CPU status, voltage, temperature, or power status changes
- A cluster experiences a VMware High Availability (HA) error
- A datastore runs low on free disk space
- A virtual machine's CPU usage, memory usage, disk latency, or even fault tolerance status changes
In addition to the small sampling of predefined alarms I've just described, there are many more, and VMware has enabled users to create alarms on just about any object within vCenter Server. This greatly increases the ability of vCenter Server to proactively alert administrators to changes within the virtual environment before a problem develops.
Because the default alarms are likely too generic for your administrative needs, creating your own alarms is often necessary. Before showing you how to create an alarm, though, I need to first discuss the concept of alarm scope. Once I've discussed alarm scope, I'll walk you through creating a few alarms. Then, in later sections of this chapter, I'll examine the use of those alarms along with other tools to monitor specific types of resource usage.
Understanding Alarm Scopes
When creating alarms, one thing to keep in mind is the scope of the alarm. In Figure 12.2, you saw the default set of alarms that are available in vCenter Server. These alarms are defined at the vCenter Server object and thus have the greatest scope -- they apply to all objects managed by that vCenter Server instance. It's also possible to create alarms at the datacenter level, the cluster level, the host level, or even the virtual machine level. This allows you, the vSphere administrator, to create specific alarms that are limited in scope and are intended to meet specific monitoring needs.
When you define an alarm on an object, that alarm applies to all objects beneath that object in the vCenter Server hierarchy. The default set of alarms that VMware provides with vCenter Server are defined at the vCenter Server object and therefore apply to all objects -- datacenters, hosts, clusters, datastores, networks, and virtual machines -- managed by that instance of vCenter Server. If you were to create an alarm on a resource pool, then the alarm would apply only to virtual machines found in that resource pool. Similarly, if you were to create an alarm on a specific virtual machine, that alarm would apply only to that specific virtual machine.
As you'll see later in this chapter, alarms are also associated with specific types of objects. For example, some alarms apply only to virtual machines, while other alarms apply only to ESX/ESXi hosts. You'll want to use this filtering mechanism to your advantage when creating alarms. For example, if you needed to monitor a particular condition on all ESX/ESXi hosts, you could define a host alarm on the datacenter or vCenter Server object, and it would apply to all ESX/ESXi hosts but not to any virtual machines.
It's important that you keep these scoping effects in mind when defining alarms so that your new alarms work as expected. You don't want to inadvertently exclude some portion of your VMware vSphere environment by creating an alarm at the wrong point in your hierarchy or by creating the wrong type of alarm.
Now you're ready to look at actually creating alarms.
Creating Alarms
As you've already learned, there are many different types of alarms that administrators might want to create. These alarms could be alarms that monitor resource consumption -- such as how much CPU time a virtual machine is consuming or how much RAM an ESX/ESXi host has allocated -- or these alarms can monitor for specific events, such as whenever a specific distributed virtual port group is modified. In addition, you've already learned that alarms can be created on a variety of different objects within vCenter Server. Regardless of the type of alarm or the type of object to which that alarm is attached, the basic steps for creating an alarm are the same. In the following sections, I'll walk you through creating a couple different alarms so that you have the opportunity to see the options available to you.
Creating a Resource Consumption Alarm
First, let's create an alarm that monitors resource consumption. As I discussed in Chapter 7, vCenter Server supports virtual machine snapshots. These snapshots capture a virtual machine at a specific point in time, allowing you to roll back (or revert) to that point-in-time state later. However, snapshots require additional space on disk, and monitoring disk space usage by snapshots was a difficult task in earlier versions of VMware Infrastructure. In vSphere, vCenter Server offers the ability to create an alarm that monitors VM snapshot space.
Before you create a custom alarm, though, you should ask yourself a couple of questions. First, is there an existing alarm that already handles this task for you? Browsing the list of predefined alarms available in vCenter Server shows that although some storage-related alarms are present, there is no alarm that monitors snapshot disk usage. Second, if you're going to create a new alarm, where is the appropriate place within vCenter Server to create that alarm? This refers to the earlier discussion of scope: on what object should you create this alarm so that it is properly scoped and will alert you only under the desired conditions? In this particular case, you'd want to be alerted to any snapshot space usage that exceeds your desired threshold, so a higher-level object such as the datacenter object or even the vCenter Server object would be the best place to create the alarm.
Perform the following steps to create an alarm that monitors VM snapshot disk space usage for all VMs in a datacenter:
1. Launch the vSphere Client if it is not already running, and connect to a vCenter Server instance.
You Must Use vCenter Server for Alarms
You can't create alarms by connecting directly to an ESX/ESXi host; vCenter Server provides the alarm functionality. You must connect to a vCenter Server instance in order to work with alarms.
2. Navigate to an inventory view, such as Hosts And Clusters or VMs And Templates. You can use the menu bar, the navigation bar, or the appropriate keyboard shortcut.
3. Right-click the datacenter object, and select Alarm _ Add Alarm.
4. On the General tab in the Alarm Settings dialog box, enter an alarm name and alarm description.
5. Select Virtual Machine from the Monitor drop-down list.
6. Be sure that the radio button marked Monitor For Specific Conditions Or State, For example, CPU Usage, Power State is selected.
7. On the Triggers tab, click the Add button to add a new trigger.
8. Set Trigger Type to VM Snapshot Size (GB). For this alarm, you're interested in snapshot size only, but other triggers are available:
- VM Memory Usage (%)
- VM Network Usage (kbps)
- VM State
- VM Heartbeat
- VM Snapshot Size (GB)
- VM CPU Ready Time (ms)
9. Ensure that the Condition column is set to Is Above.
10. Set the value in the Warning column to 1.
11. Set the value in the Alert column to 2. Figure 12.3 shows the Triggers tab after changing the Warning and Alert values.
12. On the Reporting tab, leave both the Range value at 0 and the Frequency value at 0. This ensures that the alarm is triggered at the threshold values you've specified and instructs vCenter Server to alert every time the thresholds are exceeded.
Caution: Counter Values Will Vary!
The Is Above condition is selected most often for identifying a virtual machine, host, or datastore that exceeds a certain threshold. The administrator decides what that threshold should be and what is considered abnormal behavior (or at least interesting enough behavior to be monitored). For the most part, monitoring across ESX/ESXi hosts and datastores will be consistent. For example, administrators will define a threshold that is worthy of being notified about -- such as CPU, memory, or network utilization -- and configure an alarm across all hosts for monitoring that counter. Similarly, administrators may define a threshold for datastores, such as the amount of free space available, and configure an alarm across all datastores to monitor that metric.
However, when looking at virtual machine monitoring, it might be more difficult to come up with a single baseline that works for all virtual machines. Specifically, think about enterprise applications that must perform well for extended periods of time. For these types of scenarios, administrators will want custom alarms for earlier notifications of performance problems. This way, instead of reacting to a problem, administrators can proactively try to prevent problems from occurring.
For virtual machines with similar functions like domain controllers and DNS servers, it might be possible to establish baselines and thresholds covering all such infrastructure servers. In the end, the beauty of vCenter Server's alarms is in the flexibility to be as customized and as granular as each individual organization needs.
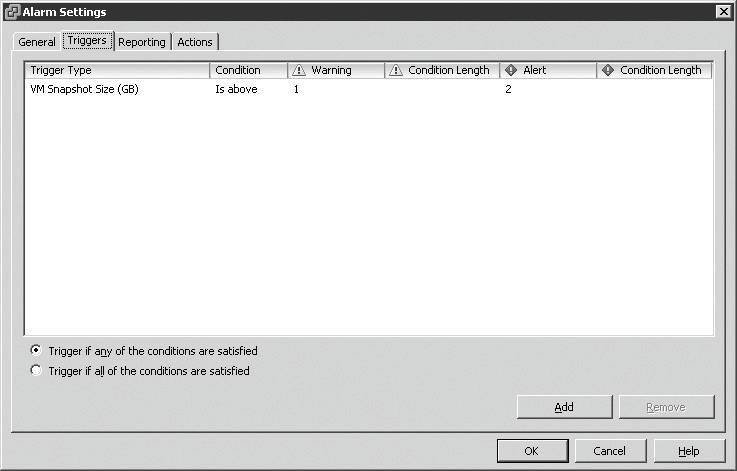
Figure 12.3
On the Triggers tab, define the conditions that cause the alarm to activate.
13. On the Actions tab, specify any additional actions that should be taken when the alarm is triggered. Some of the actions that can be taken include the following:
- Send a notification email.
- Send a notification trap via SNMP.
- Change the power state on a VM.
- Migrate a VM.
- If you leave the Actions tab empty, then the alarm will alert administrators only within the vSphere Client. For now, leave the Actions tab empty.
Configuring vCenter Server for Email and SNMP Notifications
To have vCenter Server send an email for a triggered alarm, you must configure vCenter Server with an SMTP server. To configure the SMTP server, from the vSphere Client choose the Administration menu, and then select vCenter Server Settings. Click Mail in the list on the left, and then supply the SMTP server and the sender account. I recommend using a recognizable sender account so that when you receive an email, you know it came from the vCenter Server computer. You might use something like [email protected].
Similarly, to have vCenter Server send an SNMP trap, you must configure the SNMP receivers in the same vCenter Server Settings dialog box under SNMP. You may specify from one to four management receivers to monitor for traps.
14. Click OK to create the alarm
The alarm is now created. To view the alarm you just created, select the datacenter object from the inventory tree on the left, and then click the Alarms tab on the right. Select Definitions instead of Triggered Alarms, and you'll see your new alarm listed, like in Figure 12.4.
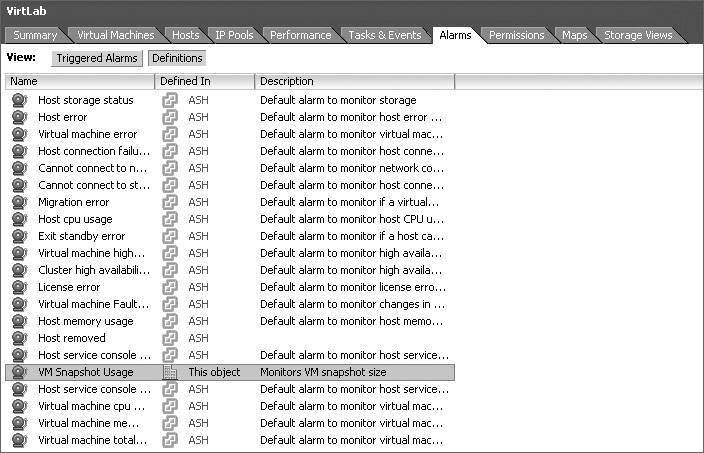
Figure 12.4
The Defined In column shows where an alarm was defined.
Using Range and Frequency with Alarms
Let's create another alarm. This time you'll create an alarm that takes advantage of the Range and Frequency parameters on the Reporting tab. With the VM snapshot alarm, these parameters didn't really make any sense; all you really needed was just to be alerted when the snapshot size exceeded a certain size. With other types of alarms, it may make sense to take advantage of these parameters.
The Range parameter specifies a tolerance percentage above or below the configured threshold. For example, the built-in alarm for virtual machine CPU usage specifies a warning threshold of 75 percent but specifies a range of 0. This means that the trigger will activate the alarm at exactly 75 percent. However, if the Range parameter were set to 5 percent, then the trigger would not activate the alarm until 80 percent (75 percent threshold + 5 percent tolerance range). This helps prevent alarm states from transitioning because of false changes in a condition by providing a range of tolerance.
The Frequency parameter controls the period of time during which a triggered alarm is not reported again. Using the built-in VM CPU usage alarm as our example, the Frequency parameter is set, by default, to five minutes. This means that a virtual machine whose CPU usage triggers the activation of the alarm won't get reported again -- assuming the condition or state is still true -- for five minutes.
With that information in mind, let's walk through another example of creating an alarm. This time you'll create an alarm that alerts based on VM network usage.
Perform the following steps to create an alarm that is triggered based on VM network usage:
1. Launch the vSphere Client if it is not already running, and connect to a vCenter Server instance.
2. Navigate to an inventory view, such as Hosts And Clusters or VMs And Templates.
3. Select the datacenter object from the inventory tree on the left.
4. Select the Alarms tab from the content pane on the right.
5. Select the Definitions button just below the tab bar to show alarm definitions instead of triggered alarms.
6. Right-click in a blank area of the content pane on the right, and select New Alarm.
7. Supply an alarm name and description.
8. Set the Monitor drop-down list to Virtual Machines.
9. Select the radio button marked Monitor For Specific Conditions Or State, For Example, CPU Usage, Power State.
10. On the Triggers tab, click Add to add a new trigger.
11. Set the Trigger Type column to VM Network Usage (kbps).
12. Set Condition to Is Above.
13. Set the value of the Warning column to 500, and leave the Condition Length setting at five minutes.
14. Set the value of the Alert column to 1000, and leave the Condition Length setting at five minutes.
15. On the Reporting tab, set Range to 10 percent, and set the Frequency parameter to five minutes.
16. Don't add anything on the Actions tab. Click OK to create the alarm.
Alarms on Other vCenter Server Objects
Although the two alarms you've created so far have been specific to virtual machines, the process is similar for other types of objects within vCenter Server.
Alarms can have more than just one trigger condition. The alarms you've created so far had only a single trigger condition. For an example of an alarm that has more than one trigger condition, look at the built-in alarm for monitoring host connection state. Figure 12.5 shows the two trigger conditions for this alarm. Note that the radio button marked Trigger If All Of The Conditions Are Satisfied is selected, ensuring that only powered-on hosts that are not responding will trigger the alarm.
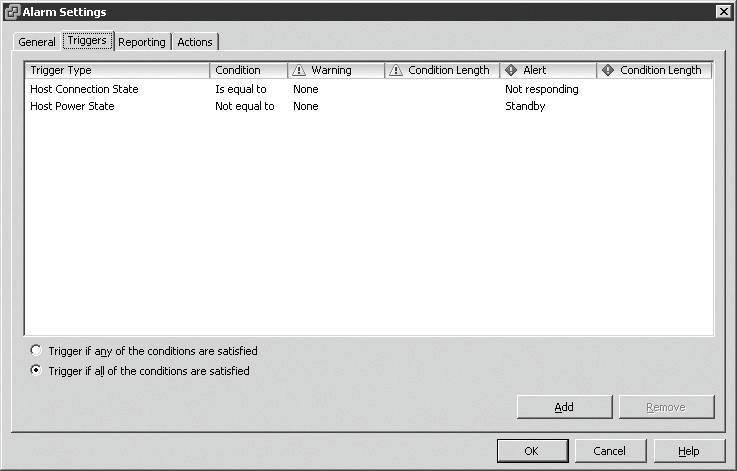
Figure 12.5
You can combine multiple triggers to create more complex alarms.
Don't Modify Built-in Alarms
In Chapter 9 I discussed vCenter Server's roles, and I mentioned that you should create custom roles instead of modifying the built-in roles supplied with vCenter Server. That same recommendation applies here: instead of modifying one of the built-in alarms, disable the built-in alarm (using the Enable This Alarm check box at the bottom of the General tab), and create a custom alarm that meets your needs.
It might seem obvious, but it's important to note that you can have more than one alarm for an object.
As with any new alarm, testing its functionality is crucial to make sure you get the desired results. You might find that the thresholds you configured are not optimized for your environment and either aren't activating the alarm when they should or are activating the alarm when they shouldn't. In these cases, edit the alarm to set the thresholds and conditions appropriately. Or, if the alarm is no longer needed, right-click the alarm, and choose Remove to delete the alarm.
You'll be able to edit or delete alarms only if two conditions are met. First, the user account with which you've connected to vCenter Server must have the appropriate permissions granted in order to edit or delete alarms. Second, you must be attempting to edit or delete the alarm from the object on which it was defined. Think back to my discussion on alarm scope, and this makes sense. You can't delete an alarm from the datacenter object when that alarm was defined on the vCenter Server object. You must go to the object where the alarm is defined in order to edit or delete the
alarm.
Now that you've seen some examples of creating alarms -- and keep in mind that creating alarms for other objects within vCenter Server follows the same basic steps -- let's take a look at managing alarms.
Managing Alarms
Several times so far in this chapter I've directed you to the Alarms tab within the vSphere Client. Up until now, you've been working with the Definitions view of the Alarms tab, looking at defined alarms. There is, however, another view to the Alarms tab, and that's the Triggered Alarms view. Figure 12.6 shows the Triggered Alarms view, which is accessed using the Triggered Alarms button just below the tab bar.
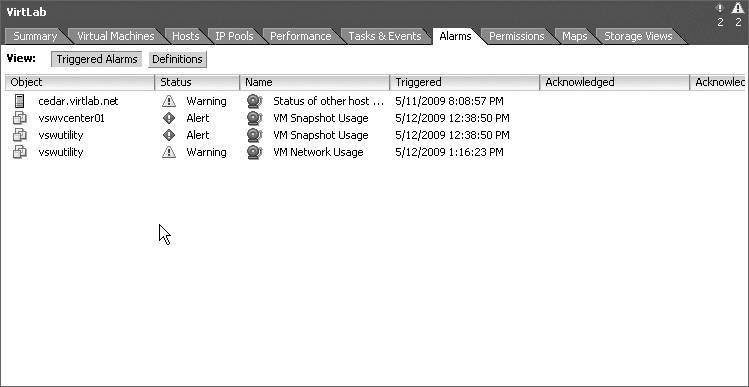
Figure 12.6
The Triggered Alarms view shows the alarms that vCenter Server has activated.
Getting to the Triggered Alarms View Quickly
The vSphere Client provides a handy shortcut to get to the Triggered Alarms view for a particular object quickly. When an object has at least one triggered alarm, small icons appear in the upper-right corner of the content pane for that object. You can see these icons in Figure 12.6. Clicking these icons takes you to the Triggered Alarms view for that object.
The Triggered Alarms view shows all the activated alarms for the selected object and all child objects. In Figure 12.6, the datacenter object was selected, so the Triggered Alarms view shows all activated alarms for all the objects under the datacenter. In this instance, the Triggered Alarms view shows four alarms: one host alarm and three virtual machine alarms.
However, if only the virtual machine had been selected, the Triggered Alarms view on the Alarms tab for that virtual machine would show only the two activated alarms for that particular virtual machine. This makes it easy to isolate the specific alarms you need to address.
After you are in Triggered Alarms view for a particular object, a couple of actions are available to you for each of the activated alarms. For alarms that monitor resource consumption (that is, the alarm definition uses the Monitor For Specific Conditions Or State, For Example, CPU Usage, Power State setting selected under Alarm Type on the General tab), you have the option to acknowledge the alarm. To acknowledge the alarm, right-click the alarm, and select Acknowledge Alarm.
When an alarm is acknowledged, vCenter Server records the time the alarm was acknowledged and the user account that acknowledged the alarm. As long as the alarm condition persists, the alarm will remain in the Triggered Alarms view but is grayed out. When the alarm condition is resolved, the activated alarm disappears.
For an alarm that monitors events (this would be an alarm that has the Monitor For Specific Events Occurring On This Object, For Example, VM Powered On option selected under Alarm Type on the General tab), you can either acknowledge the alarm, as described previously, or reset the alarm status to green. Figure 12.7 illustrates this option.
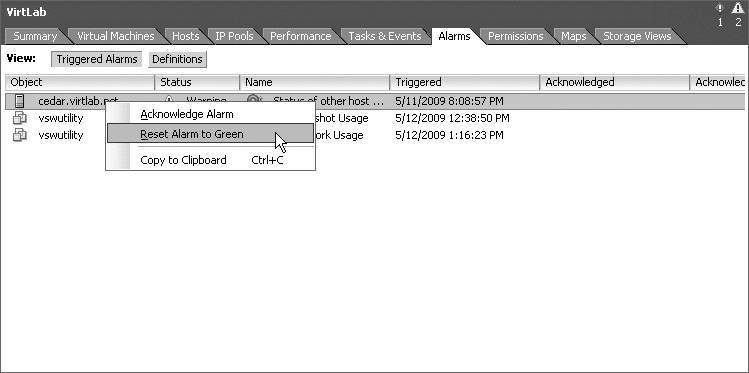
Figure 12.7
For event-based alarms, you also have the option to reset the alarm status to green.
Resetting an alarm to green removes the activated alarm from the Triggered Alarms view, even if the underlying event that activated the alarm hasn't actually been resolved. This behavior makes sense if you think about it. Alarms that monitor events are merely responding to an event being logged by vCenter Server; whether the underlying condition has been resolved is unknown. So, resetting the alarm to green just tells vCenter Server to act as if the condition has been resolved. Of course, if the event occurs again, the alarm will be triggered again.
Now that you've looked at alarms for proactive performance monitoring, let's move on to using vCenter Server's performance graphs to view even more information about the behavior of virtual machines and ESX/ESXi hosts in your VMware vSphere environment.
![]()
![]() Monitoring VMware vSphere performance
Monitoring VMware vSphere performance
![]() Monitoring vSphere performance using vCenter Server alarms
Monitoring vSphere performance using vCenter Server alarms
![]() Monitoring vSphere performance with vCenter Server performance graphs
Monitoring vSphere performance with vCenter Server performance graphs
![]() Monitoring vSphere performance with command-line tools
Monitoring vSphere performance with command-line tools
![]() Monitoring vSphere CPU and memory usage
Monitoring vSphere CPU and memory usage
Printed with permission from Wiley Publishing Inc. Copyright 2009. Mastering VMware vSphere 4 by Scott Lowe. For more information about this title and other similar books, please visit Wiley Publishing.
About the author:
Scott Lowe has more than 15 years experience in the IT industry and is an expert in virtualization technologies. Lowe is a contributing author for SearchServerVirtualization.comand SearchVMware.com and has received a VMware vExpert Award in 2008 for his work in the VMware and virtualization community. He also has his own virtualization website at blog.scottlowe.org.