
What is network monitoring?
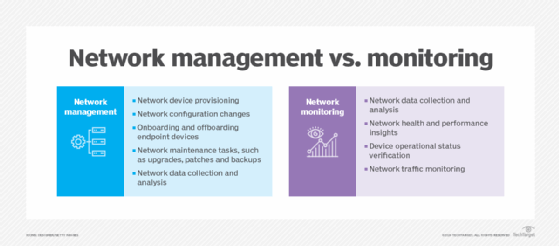
Network monitoring, also frequently called network management, is the practice of consistently overseeing a computer network for any failures or deficiencies to ensure continued network performance. Technically, network monitoring can be viewed as a subset of network management, but the two are considered equivalent in practice.
The process of network monitoring involves using specialized systems to detect common network issues, malfunctions in network devices and resource overloads, regardless of whether the resources are on-premises, in a data center or hosted in the cloud. Common network devices include routers, switches, web servers and firewalls.
How does network monitoring work?
Network monitoring collects and reports on a variety of data from a computer network, including routers, switches, firewalls, load balancers and even endpoints, such as servers and workstations. The collected data is filtered and analyzed to identify a variety of network problems and their root causes. These network problems can include device failures, link outages, interface errors, packet loss, application response time and configuration changes.
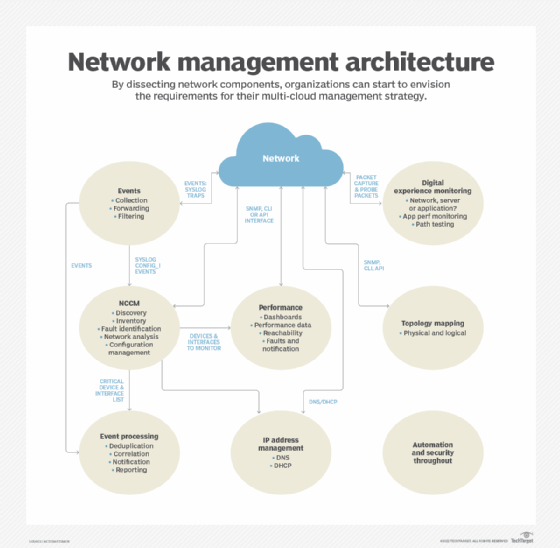
Examples include the following from each of the architectural elements:
- Events. The devices reporting the most events or the most frequently occurring events.
- Network configuration change management (NCCM). The most important devices with configuration changes or the devices with the most configuration changes.
- Performance. Highest utilization interfaces, interfaces with the most errors by count or by percentage packets or devices with the greatest CPU or memory utilization.
- Address management. Subnets that are almost out of available addresses.
- Topology. Devices with the most neighbor changes.
- Digital experience monitoring. The systems reporting the slowest applications or the paths that are exhibiting the most problems.
It's important to note that organizations frequently require a different tool for each architectural element. Consolidating the reports into one place provides a concise view of the network's operation. The reports must support links to the collected data to enable network admins to perform detailed troubleshooting.
This article is part of
What is network management?
Functions of network monitoring
The functions of a network monitoring and management system can be broken down into several categories, each of which performs a specific function.
Event collection and processing
Event collection relies on Simple Network Management Protocol (SNMP) traps and syslog to collect network event data. This enables the network to advise administrators of important events without having to poll network devices. Event processing is used to identify critical events, reducing the volume of alerts that network administrators must handle.
Network change and configuration management
NCCM archives network device configurations and can be used to automate configuration updates. Configurations might be retrieved and updated using any of several mechanisms, including the command-line interface (CLI), SNMP, RESTCONF and NETCONF.
Configuration analysis identifies day-to-day changes (drift) and audit compliance exceptions where configurations don't match network design policies.
Both drift and audit are critical functions for ensuring that network configurations match the intended design and operation.
Performance monitoring
Performance monitoring collects device performance data, such as CPU and memory utilization, temperature, power supply voltages and fan operation. Interface performance data is used to identify failures, packet loss, congestion and other network problems.
Data is collected using SNMP, Windows Management Instrumentation (WMI), the CLI or telemetry. Network devices and Linux-based endpoints typically rely on SNMP or telemetry for data collection, while Windows-based devices rely on the WMI remote protocol. WMI is a client-server framework that enables system management using the Common Information Model, which represents the components of the OS.
Telemetry
Newer devices and monitoring systems might employ network telemetry to push network performance data to a network monitoring system. Telemetry can use Extensible Markup Language- or JavaScript Object Notation-encoded data. Some network monitoring systems and related network devices use representational state transfer interfaces to collect data using these same data formats.
IP address management
IP address management tracks IP address use and controls the allocation of addresses to network devices. This function typically uses the CLI or an application programming interface (API) to other network management systems.
Topology mapping
The topology and mapping function collects device connection data to create physical and logical topology maps that form the foundation of basic troubleshooting. SNMP polling or the CLI are used to collect data on routing neighbors (Layer 3), switching neighbors (Layer 2), address translation tables (Layer 2 to Layer 3 mapping) and neighbor discovery protocols, such as Link Layer Discovery Protocol.
Digital experience monitoring
Digital experience monitoring employs active testing tools -- such as ping, traceroute and synthetic monitoring -- to test that the network is working as intended. It might also employ software agents that run on endpoints -- such as servers and workstations -- to collect data about application performance and network performance. Combining application performance monitoring with network monitoring enables IT organizations to diagnose whether an application problem is due to the network or some other factor, including external networks.
Security and automation
The architecture should include security and automation throughout. Network security continues to be an important element of a smoothly running network, and automation is used to guarantee consistent execution of network policies. The security design should include intrusion detection and intrusion prevention devices and the software to monitor and manage them. Automation may be provided by separate tools or integrated within an NCCM system.
Combining data from multiple sources enables a network monitoring system to identify failures quickly and report on performance problems before they negatively affect applications that use the network.
Types of network monitoring performance metrics
Network performance metrics provide valuable insights that help network administrators identify network issues and optimize performance.
Key network monitoring performance metrics include the following:
- Latency. Latency refers to the time it takes for a data packet to travel from the source to the destination. High latency can adversely affect the quality of user experience, especially for applications requiring low-latency communication, such as VoIP and online gaming.
- Packet loss. This metric indicates the percentage of packets that are lost during transmission. High packet loss can lead to degraded performance and is often a sign of hardware issues or network congestion.
- Jitter. Jitter refers to the variation in the time it takes for data packets to travel across a network. High jitter can disrupt the performance of applications that rely on real-time communications, such as streaming media and VoIP communications, leading to poor quality and interruptions.
- Throughput. Throughput in network monitoring refers to the amount of data that can be successfully transmitted over a network connection within a given time frame.
- Packet duplication. Packet duplication occurs when identical data packets are transmitted multiple times over a network, resulting in the same packet being received more than once at the destination.
- Round trip time. RTT measures the time it takes for a signal to travel from the sender to the receiver and back again. It is an important metric for assessing the responsiveness of a network.
- Packet reordering. Packet reordering is when data packets arrive at their destination out of the sequence in which they were originally transmitted. This can occur due to various factors, including multi-path routing and route fluttering, where a router rapidly switches between different destination routes, causing network instability.
- Error rate. This metric tracks the frequency of errors in data transmission. A high error rate might indicate problems with network hardware or interference, which can affect data integrity.
Types of network monitoring protocols
Network monitoring protocols are essential for collecting data from network devices and facilitating communication between them. Here are some of the most common types of network monitoring protocols:
- Simple network management protocol. SNMP is one of the most widely used protocols for network management which enables network administrators to monitor and manage network devices such as routers, switches and servers. SNMP operates using a client-server model, where the SNMP manager requests information from SNMP agents installed on devices.
- Internet control message protocol. ICMP is primarily used for error reporting and diagnostic functions in network communications. It is commonly used in tools such as ping to check the reachability of devices on a network and to measure round-trip time.
- Cisco discovery protocol. This is a Cisco proprietary protocol used to discover and collect information about neighboring Cisco devices. It enables Cisco devices to automatically discover each other and exchange information about their capabilities and interfaces.
- Syslog. Syslog is a standard protocol for message logging in network devices. It enables devices to send log messages to a centralized server, where they can be analyzed for troubleshooting and monitoring purposes.
- NetFlow. Developed by Cisco, NetFlow is a network protocol used to collect IP traffic information. It provides insights into traffic patterns, bandwidth usage and application performance, helping administrators analyze network performance and optimize resource allocation.
Benefits of network monitoring
A well-running network monitoring system enables the network administrators to address performance degradations proactively and react quickly to network failures.
The advantages of network monitoring include the following:
- Proactive notification and troubleshooting. Network monitoring systems enable proactive identification of anomalies and potential issues, enabling IT teams to address them promptly before they escalate. This proactive approach minimizes the time and effort invested in resolving network problems.
- Enhanced security. Monitoring network traffic can help identify suspicious activities and the rapid identification of potential security threats. By detecting these threats early, organizations can take appropriate measures to protect their data and systems.
- Uninterrupted service and delivery. By continuously monitoring the network, potential issues can be identified and resolved before major outages occur. This proactive approach minimizes downtime, ensuring uninterrupted service and network availability for end users and applications.
- Reduced complexity. Modern enterprises depend on various internet-based and business-critical services from providers such as cloud service providers, ISPs, CDNs, SaaS, UCaaS, VPN and SASE. Since these services rely on the internet, they are vulnerable to performance issues from outages or routing problems. By monitoring network components beyond their control, enterprises can proactively identify and resolve issues that can affect their employees or customers.
- Cost optimization. By minimizing downtime and enhancing network performance, organizations can reduce costs associated with lost productivity and inefficient resource utilization. Effective network monitoring facilitates optimized allocation of IT resources and budget management.
- Reduction in manual tasks. Automated monitoring tools reduce the need for manual checks and interventions, enabling IT staff to focus on more strategic initiatives rather than routine maintenance tasks.
- Network visualization. Network monitoring tools often provide graphical representations of network data through network maps, performance dashboards and trend analysis. Visualizing the performance of the IT infrastructure is crucial as it provides valuable insights, improves decision-making and helps ensure a stable and efficient IT infrastructure.
- Network visibility. Network monitoring provides administrators with comprehensive visibility into the network, enabling them to identify all connected devices, observe data flow and swiftly identify and resolve issues that could degrade performance or cause outages.
- Compliance and reporting. Many industries are subject to regulatory requirements pertaining to data security and network performance. Network monitoring enables organizations to maintain compliance by providing the necessary data and reports that demonstrate adherence to these policies.
Network monitoring software
Network monitoring software is available from a variety of sources, including open source and commercial. Open source tools often have a paid support version, frequently including premium features beyond those available in the free version. If a network uses devices from multiple vendors, then the network monitoring system needs to support those products. Vendor-supplied software rarely supports devices from other vendors.
Monitoring tools have adapted to the expansion of networks to cloud and SaaS. Network equipment vendors are frequently integrating controller-based architectures that incorporate many of the required monitoring and control functions. These controllers typically include APIs for integration with automation systems and other network monitoring and management tools.
Finding a single monitoring tool is difficult. The variety of functionality that is needed for network management makes it challenging for a single product to do everything. The most successful approach matches a network monitoring tool with its corresponding functional category. For example, an event processing system has different requirements than a network performance monitoring system. Collecting useful summaries, such as the top N reports, into a single dashboard often has the best results.
Organizations should also remember to include staffing requirements. Monitoring tools should be supported by at least two staff members who can keep them updated and be the experts on its operation.
When it comes to network monitoring and management costs, one rule of thumb is to keep it at 10% of the annual amortized cost of the network. These software packages require a lot of development effort, and organizations typically purchase one copy. Organizations shouldn't expect to monitor and manage a $1 million network using a $20,000 system. Alternatively, network administrators can calculate the cost of network downtime and factor that into the cost of the network monitoring systems.
Network monitoring best practices
Setting up effective network monitoring is crucial for maintaining the performance, security and reliability of an organization's IT and network infrastructure.
Here are some best practices to consider:
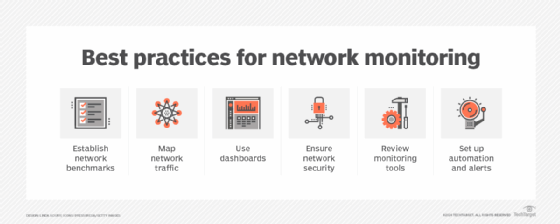
- Establish clear objectives and benchmarks. Before setting up network monitoring, organizations should define clear goals and objectives and determine what they want to achieve, such as improving uptime, enhancing security or optimizing performance. Organizations should also establish network performance benchmarks to define normal network behavior. This will guide their monitoring strategy and help them focus on the most critical aspects of their network.
- Utilize comprehensive monitoring tools. Businesses should choose network monitoring tools that offer a wide range of functionalities, including real-time monitoring, alerting, traffic analysis and reporting. Comprehensive tools can provide deeper insights into network performance and help quickly identify issues.
- Set up proactive monitoring. Rather than waiting for issues to occur, organizations should adopt a proactive monitoring approach. Continuous monitoring of network performance, coupled with the establishment of alerts for potential problems, enables the identification and resolution of issues before they escalate. This proactive approach minimizes downtime as well as disruptions.
- Prioritize critical assets. Companies should identify and prioritize critical network components, such as servers, applications and devices. They should ensure that these assets receive the highest level of monitoring and attention as they are vital for business operations.
- Regularly review and update monitoring configurations. Network environments are dynamic, and configurations might need to change over time. Companies should regularly review and update their monitoring settings to ensure they align with current network architecture and business needs.
- Analyze historical data. Organizations should utilize historical data to identify trends and patterns in network performance. This analysis can help make informed decisions about capacity planning, resource allocation and potential upgrades.
- Integrate security monitoring. Security monitoring should be incorporated into a network monitoring strategy. This includes tracking unusual traffic patterns, unauthorized access attempts and other security threats. A holistic approach to monitoring helps protect the network from vulnerabilities.
- Train the team. The IT team should be well-trained in using monitoring tools and understanding network performance metrics. A knowledgeable team can respond more effectively to alerts and issues, improving overall network management.
Network monitoring examples
A good example system depends on the requirements, such as the event volume and the number of device interfaces to be monitored. Large networks have different requirements than a small organization's needs. Complex multi-cloud, SaaS, colocated data centers and on-premises data centers require more complex monitoring systems.
A network is a large, complex system in which many things need to work correctly for optimum network health and application performance. It should be monitored as an entire system, not a collection of devices. Organizations shouldn't skimp on thorough coverage. Monitoring a subset of active data center interfaces and key interfaces is a recipe for an undetected failure.
Some practical examples of network monitoring include the following:
- Monitoring device health and functionality. Overseeing the functionality of routers is a common example of network monitoring. Routers connect private networks to the internet and monitoring their performance helps ensure that users can access online resources without interruptions. Router monitoring can typically include tracking metrics such as throughput, error rates and latency. Monitoring other network devices, such as switches, firewalls and servers through dashboards and tools is also crucial. Network monitoring tools can evaluate the status of these devices and notify administrators if any go offline or experience performance issues, ensuring that all network components function smoothly.
- Traffic monitoring. Traffic monitoring helps identify bottlenecks and optimize bandwidth monitoring and usage. Network monitoring tools can perform both passive and active traffic monitoring. Passive monitoring involves listening on network ports to analyze traffic patterns, while active monitoring might include sending pings or TCP requests to test how servers respond.
- DNS monitoring. Monitoring the domain name system (DNS) is vital for ensuring that users can access websites and services without delays. This involves tracking DNS query response times and error rates, which can help identify issues with domain resolution.
- Security monitoring. Network infrastructure monitoring tools can help detect unusual traffic patterns that might indicate security threats, such as unauthorized access attempts or data breaches. By continuously monitoring network traffic and setting up automated alerts, organizations can respond quickly to potential security incidents.
- Application performance monitoring. Network monitoring can also extend to applications running on the network. By tracking metrics such as response times and transaction times, organizations can ensure that applications perform optimally.
Network monitoring and network management are closely related concepts that work together to optimize network operations. Explore the similarities and differences between the two to understand how they function.