What is product analytics, and why is it important?
Product analytics is the process of gathering and transforming user-level data into insights that reveal how customers interact with specific products. It enables organizations to track and analyze user behavior throughout their journey, from first interaction to repeat engagement, to understand what drives retention, conversion and long-term value.
Usage data collected through product analytics often includes information such as the most frequently used features, session duration, interaction sequences and return frequency -- all presented in daily, weekly or monthly intervals. This behavioral intelligence enables product teams to refine user experiences (UX), prioritize feature development and align with customer needs.
While product analytics is most commonly used by software as a service (SaaS) and mobile app companies, it is increasingly important for e-commerce, fintech, healthtech and other digital-first businesses. Teams that include product managers, designers, engineers, growth marketers and UX researchers rely on product analytics to make evidence-based decisions.
Importance of product analytics
Product analytics delivers objective data on what users actually do, as opposed to what they claim in surveys or interviews. This distinction helps product teams to do the following:
- Validate product-market fit.
- Identify usage bottlenecks and abandonment points.
- Prioritize improvements based on actual user behavior.
- Personalize features or experiences for different segments.
Unlike qualitative feedback, product analytics offers large-scale, real-time visibility into user actions, to help teams identify high-value patterns and optimize for measurable outcomes like retention, engagement and revenue.
Product analytics also plays a vital role in launching new features. Using the analytic data, teams can do the following:
- Benchmark usage expectations.
- Monitor engagement over time.
- Conduct A/B tests to compare variants.
- Iterate based on quantitative evidence.
In a highly competitive environment, companies such as Netflix, Uber, Amazon and Spotify use product analytics as a cornerstone of their product strategy.
How to implement product analytics
Implementing product analytics involves several foundational steps:
- Determine readiness. Product analytics is most effective when a product has achieved some baseline adoption. For early stage products with small user bases, qualitative research methods might offer more actionable insights.
- Align analytics with business goals. Define measurable objectives, such as increasing feature adoption, improving onboarding or reducing churn.
- Create a tracking plan. Events are the building blocks of product analytics. Each event represents a user action (e.g., button click, form submission, purchase). A solid tracking plan should map out the following:
-
- Key events and event properties to collect.
- User and account-level attributes.
- Desired funnel paths and usage flows.
- Choose the right tools. Product analytics tools offer varying levels of flexibility, segmentation, visualization and integration. Many teams also combine product analytics with a customer data platform (CDP) like Twilio Segment or RudderStack.
- Instrument the product. Integrate analytics SDKs into your app or website to capture the defined events. Proper QA ensures accuracy and data integrity.
How to use product analytics
Once the system is in place, teams use product analytics as follows:
- Visualize funnels. Identify where users drop off during key flows, such as onboarding or checkout.
- Measure retention and engagement. Track how often users return and how they interact over time.
- Segment users. Analyze behavior by cohort (e.g., trial versus paid users, geographies or acquisition channels).
- Identify friction points. Spot features or workflows where users abandon or fail to complete desired actions.
- Optimize experiments. Use A/B testing tools to validate hypotheses and iterate quickly.
Examples of product analytics in action include the following:
- A fintech app reduces support tickets by tracking failed login attempts and improving the password recovery UX.
- An e-commerce company boosts conversions by identifying which product filters lead to the most purchases.
- A SaaS platform increases retention by sending targeted in-app messages based on inactivity.
Product analytics tools
The right product analytics tool depends on your company's size, data maturity and tech stack. Popular product analytics tools include the following:
- Google Analytics 4 (GA4). Free and widely used, GA4 features event-based tracking and integration with Google Ads.
- Mixpanel. This tool focuses on product event tracking, cohort analysis and funnel visualization.
- Amplitude. Amplitude offers advanced behavioral analytics, experimentation and predictive analytics.
- Heap. This app automatically captures user interactions (no code tagging required).
- PostHog. This open source analytics app provides session recording and feature flags.
- Twilio Segment. Segment is a CDP that routes user data to analytics, CRM, marketing and other tools.
Key features to look for include the following:
- Real-time dashboards.
- Funnel and retention analysis.
- Segmentation and cohorts.
- A/B testing capabilities.
- Role-based access and data governance.
Product analytics vs. marketing analytics
Although complementary, product analytics and marketing analytics serve different purposes:
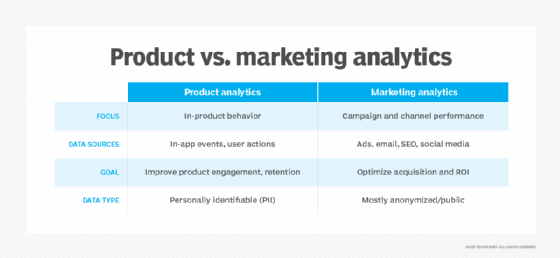
Product analytics supports full-funnel optimization by picking up where marketing analytics leaves off by tracking behavior after users arrive.
Privacy and compliance in product analytics
With data privacy regulations like GDPR, CCPA and HIPAA expanding, companies must ensure product analytics practices align with legal standards.
Key compliance considerations include the following:
- Minimizing use of personally identifiable information (PII).
- Offering opt-outs or cookie consent mechanisms.
- Storing data securely and limiting access.
- Maintaining clear data retention policies.
Some analytics tools provide anonymization features and server-side tracking to help reduce compliance risks. Businesses operating in sensitive industries such as finance or healthcare must choose tools that meet stricter security and privacy benchmarks.
Common product analytics mistakes to avoid
Many teams underuse or misuse product analytics, which can lead to wasted resources or misleading conclusions. Common pitfalls are as follows:
- Tracking too many events. Without focus, dashboards become noisy and insights unclear.
- Not aligning tracking to goals. Data without business context leads to irrelevant conclusions.
- Skipping QA. Poor event instrumentation leads to inaccurate or missing data.
- Ignoring qualitative input. Combining product analytics with user interviews, surveys or session recordings gives better context.
- Overlooking privacy risks. Collecting too much PII can result in regulatory violations.
Start small, track only what matters and build analytics maturity over time.
Learn how organizations collect customer feedback to improve their experiences.