I/O (input/output)

What is I/O (input/output)?
I/O (input/output), pronounced "eye-oh," describes any operation, program or device that transfers data to or from a computer. Common I/O devices include printers, hard disks, keyboards and mice.
Input/output devices play a crucial role in computer programming by streamlining how computing devices communicate across a network.
Why is I/O important?
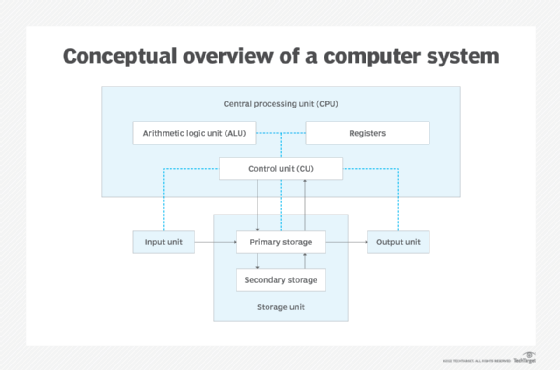
In computer architecture, I/O encompasses a range of tasks that must be executed properly to support sharing data among discrete machines. All types of data movement within a system rely on I/O operations, including audio files, software instruction sets, text and video streams.
Input/output signals carry instructions that a computer's central processing unit (CPU) must execute to initiate data transfer. The input can come from hardware, software or human interaction.
I/O input signals shuttle data from a CPU, storage controller or memory to a storage device. I/O output signals flow from a computer to an output device.
Some I/O devices are input-only devices, meaning they send data but do not receive data; output-only devices do the opposite, receiving input but not able to send data to other machines. Some I/O devices receive input, process the data and produce output.
How do I/O operations occur?
I/O devices are categorized generally as storage, network communications, user interface or related hardware services that use discrete systems to interface with a computer. To communicate, devices use parallel or serial I/O ports, or an over-the-air signal.
Input/output falls into two categories: hard I/O and soft I/O. Hard I/O refers to a straightforward transfer of data that occurs between a computer and an external physical device, such as a keyboard or a mouse. Soft I/O occurs when data is transferred between computers or servers over a network, such as streaming media or file sharing.
I/O operations are calculated based on the number of operations that occur per second, also known as IOPS, or as a measure of transfer speed. I/O performance is affected by the capabilities of the equipment within a computer, including drives, graphics cards and network gear.
What is I/O memory management?
Modern computing systems are often built with an I/O processor situated between the system bus and attached peripherals. I/O processors are specifically equipped to handle the operations associated with data transfer.
To facilitate communication between I/O devices and processors, an I/O interface identifies all addresses generated by the CPU. Controllers are tasked with making sure data is transmitted to the computer's assortment of components. Various control methods are used, including the following:
- Programmed I/O (PIO). This method requires the processor to execute commands for every I/O transfer; thus, it is the slowest method. The advantage is that programmed I/O is the simplest to program.
- Interrupt-driven I/O. With this method, an I/O device sends a command when it is ready to receive data. The CPU then suspends what it is doing temporarily to carry out the new instructions before resuming its prior activities. In this way, the CPU does not need to check the receiving status of the I/O device.
- Advanced Programmable Interrupt Controller (APIC). This variation sends an interrupt signal to the APIC to notify the processor when a device is prepared to send data.
- Direct memory access (DMA). DMA bypasses the CPU to send data commands from peripherals to main memory. DMA is the replacement for PIO, also known as programmable I/O, a process in which the CPU manages all data transactions.
- Input-output memory machine unit (IOMMU). Designed for virtual machines, IOMMU allows an operating system (OS) to correlate the mapping of physical and virtual devices to efficiently allocate memory resources.
What's the difference between I/O input and I/O output?
I/O devices are categorized as storage, networking, user interface or related hardware-enabled services that connect discrete machines or systems.
Management of I/O devices is handled by the computer's OS via a dedicated subsystem designed to manage device drivers or any attached hardware. Modern computers support a range of devices, including audio and video drives, Bluetooth adapters, disk drives, display adapters, dongles, high-speed printers, modems, USB flash drives and mobile hotspots.
An I/O input device creates an interface between end users and a computer or another information system. The input device sends commands via a hardware component, software or human interaction. In I/O input, data flows from the device to a computer.
I/O output operations refer to data signals sent by the output device in response to the data input. The data flows from the computer to the output device, where it is extracted and processed. The processing ensures the data output is presented in a manner that users will understand.
What are I/O input devices?
I/O input-only devices include the following:
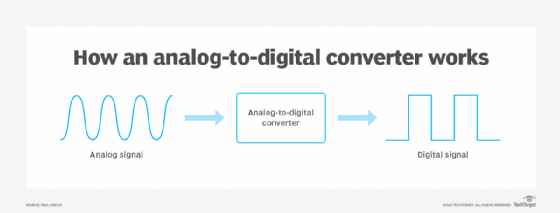
- Analog-to-digital converters.
- Barcode readers.
- Biometric devices.
- Computer mice and trackballs.
- Digital cameras.
- Electronic drum kits.
- Joysticks.
- Keyboards.
- Light pens.
- Magnetic stripe readers.
- Magnetic tape drives.
- Microphones.
- Optical character recognition readers.
- Scanners.
- Sensors.
- Stylus pens.
- Touchscreens.
- Webcams.
What are I/O output devices?
Devices that handle only I/O output include the following:
- Braille readers.
- Cathode-ray tube monitor displays.
- Graphics cards.
- Headphones.
- Liquid crystal display panels.
- Printers and plotters.
- Projectors.
- Speakers.
Which I/O devices provide data input and data output?
Voice-activated virtual assistants illustrate technologies that handle both input and output of data. When users vocalize search requests, these devices retrieve the requested information and convey the results using natural language processing. The user's request is the input; the device's voice response is the output.
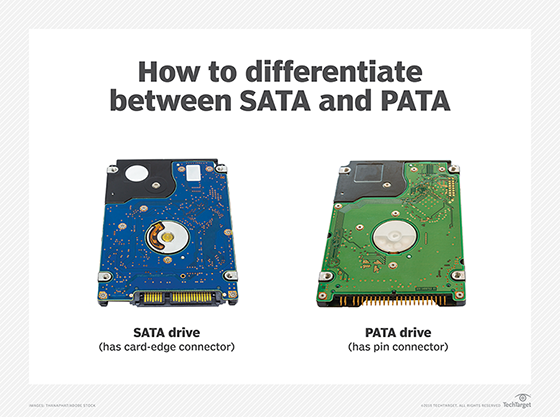
Hard disk drives and solid-state drives (SSDs) can be classified as both input and output devices. Data is written to NAND flash-based drive sectors and can also be fetched from the SSD.
Other devices that are able to send and receive data include the following:
- Diskettes.
- High-performance computing systems.
- Modems.
- Network interface cards.
- Removable storage devices.
- Writable CD-ROMs.
Some experts claim that disk and flash drives fall under storage, whereas I/O operations are aligned with network bandwidth. Others argue that disk and flash storage allow data reads and writes, and thus can receive data input and produce data output.
See seven major server hardware components you should know and learn the differences between flash memory vs. RAM.