exponential function
What is exponential function?
An exponential function is a mathematical function used to calculate the exponential growth or decay of a given set of data. For example, exponential functions can be used to calculate changes in population, loan interest charges, bacterial growth, radioactive decay or the spread of disease. At its most basic, an exponential function takes the following form.
f(x) = ax
The function's variable, x, is used for the exponent. Its constant, a, is used for the base. This is in contrast to other mathematical functions in which the base is a variable and the exponent is a constant. In an exponential function, the base can be any number greater than 0, except 1. If the base is greater than 1, the function calculates exponential growth. If it is greater than 0 but less than 1, the function calculates exponential decay. The base serves as a starting point for calculating the growth or decline.
Calculating exponential growth
To get a better sense of how exponential functions work, you can specify a base constant for the function, plug in different values for the exponent, and then plot the results on a graph. This will show you how the numbers arc upward as they grow exponentially. For example, the following exponential function specifies 2 as the base constant.
f(x) = 2x
From this formula, you can start with -2 for the x variable and increment it by 1 to calculate your plot points up to 2, which gives you five results. The x variable provides the x-axis coordinates, and the function's results provide the y-axis coordinates, as shown in the table.
| Formula | x-axis | y-axis |
| y = 2-2 | -2 | 0.25 |
| y = 2-1 | -1 | 0.5 |
| y = 20 | 0 | 1 |
| y = 21 | 1 | 2 |
| y = 22 | 2 | 4 |
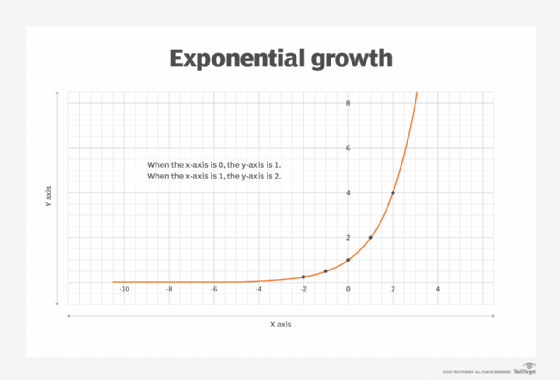
The following figure shows the coordinates plotted on the graph and connected by an arcing curve that swoops upward. The lower the x value, the nearer the curve follows the horizontal asymptote (the 0 y-axis). The higher the value, the farther the curve veers from that axis.

In Figure A, as the x-axis coordinates are increased by 1, the y-axis coordinates increase at a much faster rate, causing the arc to curve sharply upward. The y-axis coordinates grow exponentially based on the specified constant and changing variable values. When the x-axis is 0, the y-axis is 1. When the x-axis is 1, the y-axis is 2. When the x-axis is 2, the y-axis is 4. The y-axis doubles each time the exponent is incremented by 1, causing the arc to move dramatically up the graph. When the x-axis coordinate reaches 6, for example, the y-axis has climbed to 64, which is far off the graph in the figure.
Such growth over time often is referred to as hockey stick growth, where the "blade" of the stick starts off flat but rises along the "shaft."
Calculating exponential decline
The process for calculating exponential decline is similar to exponential growth, except that the base constant must be between 0 and 1. For example, the following formula uses 0.5 as the base constant.
f(x) = 0.5x
If you were to use the same five values for the x variable that you used when calculating exponential growth, you would get the results shown in the table.
| Formula | x-axis | y-axis |
| y = 2-2 |
-2 |
4 |
| y = 2-1 |
-1 |
2 |
| y = 20 |
0 |
1 |
| y = 21 |
1 |
0.5 |
| y = 22 |
2 |
0.25 |
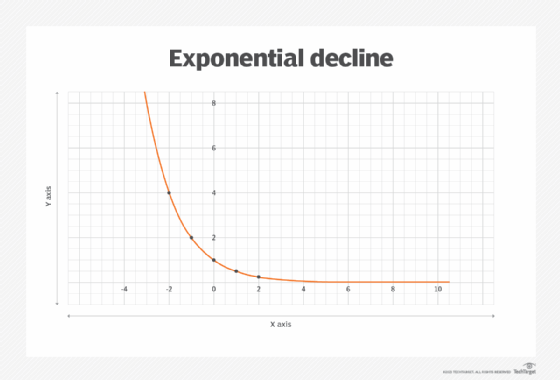
In this case, the y-axis coordinates decrease as the x-axis increases. Each time the x variable is incremented by 1, the y-axis coordinate is reduced by one-half as it steadily approaches -- but never reaches -- the horizontal asymptote. If you plot out these points, you'll see that they still form a dramatic arc. Only this time, the direction is opposite what you get with exponential growth, as shown in the following figure.

As Figure B shows, with exponential decline, the arc curves down sharply as it steadily approaches the horizontal asymptote. In fact, the numbers get so small that they're difficult to graph with any precision beyond a certain point.
Using specific constants in exponential functions
Exponential functions commonly use Euler's number for their base constant. Euler's number is an irrational number, which means that it cannot be reduced to a simple fraction, just like pi. Euler's number is commonly represented as e, which equals approximately 2.71828. The e is used in place of the a in an exponential function.
f(x) = ex
An exponential function that uses Euler's number is referred to as a natural exponential function. It is highly useful for calculating data that grows exponentially over time, such as populations or interest rates. Euler's number is also the base for the natural logarithm.
Electronics and experimental science often use base-10 exponential functions to calculate exponential growth and decline. These types of functions use 10 as their base constant.
f(x) = 10x
When the exponent increases by 1, the value of the base-10 function increases by a factor of 10. When the exponent decreases by 1, the value of the function is 1/10 the previous amount. A change of this extent is called one order of magnitude.
For a given base constant such as e or 10, the exponential function "undoes" the logarithm function, and the logarithm function undoes the exponential function. Thus, they serve as inverses of each other. For example, if calculating a logarithm in which the base is 10 and x equals 3, the result will be 3.
log (10x) = log (103 ) = log 1000 = 3
In contrast, if a base-10 exponential function has an exponent of log x and x equals 1000, the result will be 1000.
10(log x) = 10(log 1000) = 103 = 1000
Exponential functions can take many other forms and include additional constants. But they all follow the same basic formula and use a variable as an exponent rather than relying on a variable for the base value.
Check out commonly used mathematical symbols with examples and how they are used.
